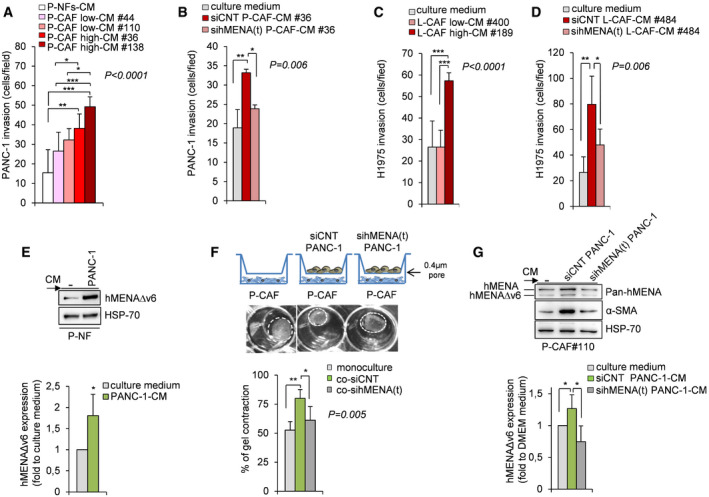
Figure 4. hMENA/hMENAΔv6 mediates the reciprocal dialogue between tumor cells and CAFs.

- Quantification of in vitro Matrigel invasion assay of PANC‐1 cells cultured for 48 h with conditioned media (CM) of NFs (P‐NFs-CM), CAF low #44 and #110 and CAFs high #36 and 138. Histograms show the number of invading cells measured by counting 6 random fields. Data are presented as the mean ± SD of three biological replicates, performed at least in duplicate each. Statistical analysis was performed with one‐way ANOVA P < 0.0001, followed by Bonferroni's multiple comparison test. *P < 0.05, **P < 0.01, ***P < 0.001.
- Quantification of in vitro Matrigel invasion assay of PANC‐1 cultured for 48 h with CM derived from control P‐CAFs#36 (siCNT‐P-CAF‐CM#36) and hMENA/hMENAΔv6 silenced P‐CAFs (sihMENA(t)‐P-CAF‐CM#36), showing that the siRNA‐mediated knock‐down of hMENA/hMENAΔv6 affects PANC‐1 invasive ability mediated by CAF‐CM. Culture medium (DMEM) was used as control. Cells invading Matrigel were counted in 6 random fields. Data are presented as the mean ± SD of three biological replicates. Statistical analysis was performed with one‐way ANOVA P = 0.006, followed by Bonferroni's multiple comparison test. *P < 0.05, **P < 0.01.
- Quantification of in vitro Matrigel invasion assay of H1975 cells cultured for 48 h with control media (culture medium) or conditioned media (CM) of L‐CAF low #400 and CAFs high #189, as described above. Data are presented as the mean ± SD of two biological replicates, performed in triplicates each. Statistical analysis was performed with one‐way ANOVA P < 0.0001, followed by Bonferroni's multiple comparison test. ***P < 0.001.
- Quantification of in vitro Matrigel invasion assay of H1975 cultured for 48 h with CM derived from control L‐CAFs#484 (siCNT‐L-CAF‐CM#484) and hMENA/hMENAΔv6 silenced L‐CAFs (sihMENA(t)‐L-CAF‐CM#484), showing that the siRNA‐mediated knock‐down of hMENA/hMENAΔv6 affects H1975 invasive ability mediated by CAF‐CM. Culture medium (DMEM) was used as control. Cells invading Matrigel were counted in 6 random fields. Data are presented as the mean ± SD of six replicates. Statistical analysis was performed with one‐way ANOVA P = 0.006, followed by Bonferroni's multiple comparison test. *P < 0.05, **P < 0.01.
- Representative immunoblot (top) and densitometry quantification (bottom) of hMENAΔv6 expression level in P‐NFs grown in RPMI control medium (−) or PANC‐1–CM for 24 h (n = 3). Data are represented as fold increase with respect to control medium ± SD (set as 1). Data were analyzed using two‐sided Student's t‐test. *P < 0.05.
- Representative images (top) and quantification (bottom) of collagen gel contraction ability of CAFs (monoculture) or CAFs co‐cultured with siCNT (co‐siCNT) or sihMENA(t) PANC‐1 cells (co‐sihMENA(t)). Dashed white circles illustrate the margins of the gel area. Data are presented as the mean ± SD of two biological replicates. Statistical analysis was performed with one‐way ANOVA P = 0.005, followed by Bonferroni's multiple comparison test ANOVA: *P < 0.05, **P < 0.01.
- Representative immunoblot (top) and quantification (bottom) of hMENAΔv6 and α‐SMA expression in P‐CAFs #110 treated with DMEM (−) or with conditioned medium (CM) derived from siCNT (siCNT PANC‐1) or sihMENA(t) PANC‐1 cells ((sihMENA(t) PANC‐1) (n = 3). Data are represented as fold increase with respect to DMEM (set as 1 ± SD). Data presented were analyzed using two‐sided Student's t‐test: *P < 0.05.
Source data are available online for this figure.
