-
A
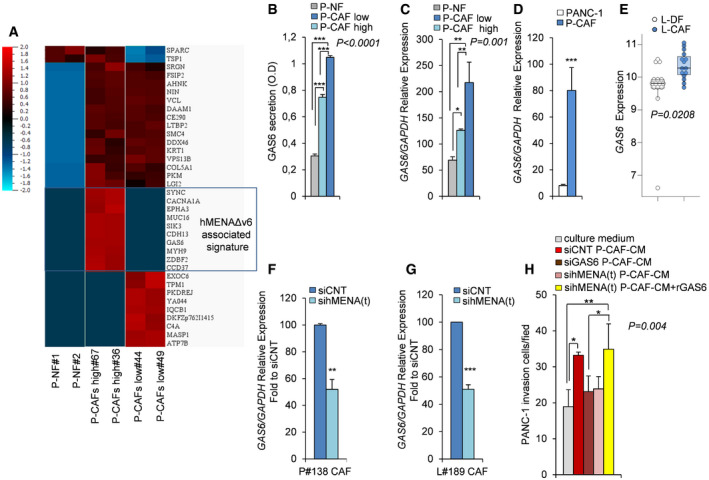
Heat map of proteins identified by LC‐MS/MS analysis as differentially secreted in CM of normal fibroblasts (P‐NF#1 and P‐NF#2), CAFs with low level of hMENAΔv6 expression (P‐CAFs low#44 and #49), CAFs with high level of hMENAΔv6 expression (P‐CAFs high #67 and #36).The boxed hMENAΔv6 associated signature represents proteins exclusively present in the CM derived from CAFs high. Color code is shown in the upper left corner. Co‐variance = 0.2, q‐value = 0.1 (10% false discovery rate), adjusted P value = 0.0074542. N = 36. The values of mass spec identified for each protein were plotted in log2 scale.
-
B
Quantification of GAS6 secretion levels, as detected by ELISA, in the CM of P‐NF (#1), P‐CAFlow (#44 and #49) and P‐CAF high (#67 and #36). Data are presented as the mean ± SD of two biological replicates. Statistical analysis was performed with one‐way ANOVA P < 0.0001, followed by Bonferroni's multiple comparison test. ***P < 0.001.
-
C
Real‐time qRT–PCR analysis of the relative GAS6 mRNA expression level in NFs (P‐NF#1), P‐CAF low and P‐CAF high, as described above. Data are presented as the mean ± SD of three replicates. Statistical analysis was performed with one‐way ANOVA P = 0.001, followed by Bonferroni's multiple comparison test. *P < 0.05, **P < 0.01.
-
D
Real‐time qRT–PCR analysis of the relative GAS6 mRNA expression level in PANC‐1 and P‐CAF (n = 3), showing a low GAS6 expression in PANC‐1 cells. Data are presented as the mean ± SD. P values were calculated by two‐sided Student's t‐test. ***P < 0.001.
-
E
Boxplots showing the mRNA expression of GAS6 in normal lung fibroblasts (white) (
n = 15) versus primary NSCLC fibroblasts (light blue) (
n = 15) (
GSE22862 data set). In each boxplot the median value (horizontal line), 25
th–75
th percentiles (box outline), and highest and lowest values within 1.5× of the interquartile range (vertical line) are shown. Statistical significance was calculated by Mann–Whitney
U‐test (two‐sided) (
P = 0.0208).
-
F, G
Real‐time qRT–PCR analysis of P#138 CAF (F) and L#189 CAF (G) transfected with control siRNA (siCNT) or hMENA(t) siRNA (sihMENA(t)) as representative cases. The siRNA‐mediated knock‐down of hMENA/hMENAΔv6 resulted in a significant reduction of GAS6 mRNA expression levels compared to siCNT cells (set as 100). Data are presented as the mean ± SD of three replicates. P values were calculated by two‐sided Student's t‐test **P < 0.01, ***P < 0.001.
-
H
Quantification of Matrigel invasion assay of PANC‐1 cultured for 48 h with DMEM (culture medium), or conditioned medium (CM) derived from control siRNA P#106 CAFs (siCNT P‐CAF-CM), GAS6 siRNA (siGAS6 P-CAF‐CM), hMENA(t) siRNA (sihMENA(t) P-CAF‐CM), hMENA(t) siRNA plus rGAS6 (sihMENA(t) P‐CAF-CM + rGAS6). Number of invaded PANC‐1 cells after 48 h of treatment was measured by counting 6 random fields. Data are presented as the mean ± SD of three biological replicates. Statistical analysis was performed with one‐way ANOVA P = 0.004, followed by Bonferroni's multiple comparison test. *P < 0.05, **P < 0.01.

