
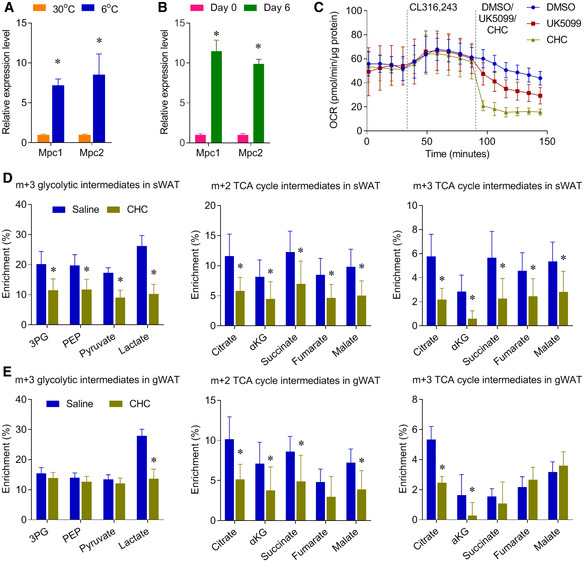
Figure EV5. CHC represses glucose metabolism in multiple adipose tissues.
-
ARelative mRNA levels of Mpc1/2 expression were measured by qPCR in BAT of the mice, housed at 30 or 6°C for 10 days. n = 5–6 biological replicates.
-
BRelative mRNA levels of Mpc1/2 expression were measured by qPCR in the pre‐differentiated day 0 and fully differentiated brown adipocytes day 6. n = 4 biological replicates.
-
COxygen consumption rate (OCR) of mouse brown adipocytes treated with MPC inhibitor CHC (2 mM) or UK5099 (2 μM), n = 6–7 biological repeats. CL, CL316,243.
-
D, EMice were housed at 6°C for 10 days, and mice were IP injected with PBS or CHC (500 mg/kg). 30 minutes after CHC treatment, mice were administered with [U‐13C]glucose (2 g/kg, IP). Metabolic 13C enrichments in sWAT (D) and gWAT (E) of male mice are shown as m+2 and m+3 TCA cycle intermediates. n = 7 biological replicates.