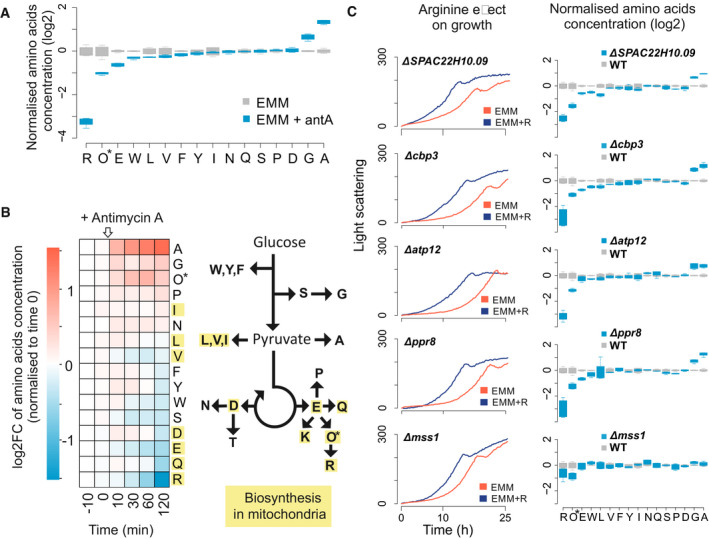
Figure 2. Respiratory inhibition alters levels of cellular amino acids.

- Normalised concentration values of 16 amino acids in cells grown in EMM without (grey) or with (blue) antimycin A. For each condition, four independent samples were analysed. Concentrations are presented relative to the mean value for the given amino acid in EMM medium. *Ornithine (Orn) is abbreviated as O. Boxplots were created using R boxplot command with default settings. The central band indicates the median, the upper and lower limits of the box indicate first and third quartiles, and the whiskers show the most extreme data, limited to 1.5‐time interquartile range.
- Amino‐acid concentrations before and after addition of antimycin A to cells exponentially growing in EMM. Left: heat map showing concentration changes (log2 fold change) of each measured amino acid during the time course relative to time point 0 (before antimycin A addition). Right: simplified scheme of amino‐acid biosynthetic pathways. Amino acids for which any biosynthetic enzyme has an annotated mitochondrial location are highlighted in yellow. *Ornithine (Orn) is abbreviated as O.
- Left panels: cell growth in EMM without (red) or with (blue) arginine supplementation for five selected respiratory mutants as indicated (graphs selected from Fig EV3). Right panels: normalised intracellular amino‐acid concentrations as in (A) for the same five respiratory mutants (blue) and wild‐type control cells (grey). For each mutant and the wild‐type strain, four independent samples were analysed. *Ornithine (Orn) is abbreviated as O. Boxplot features as in (A).
