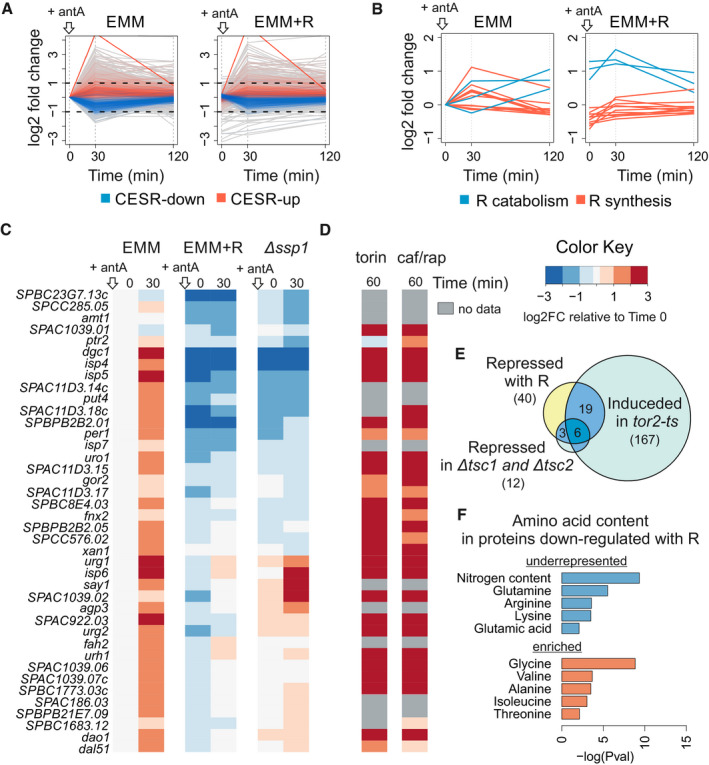
Figure 4. Transcriptome regulation in response to respiratory inhibition and arginine supplementation.

- Changes in transcript abundance 30 and 120 min after addition of antimycin A to exponentially growing cells without (EMM) or with arginine (EMM + R). Transcripts annotated as up‐ or down‐regulated core environmental stress response (CESR) are indicated in red and blue, respectively. All data are normalised to EMM time point 0.
- Graphs as in (A) showing expression profiles of transcript encoding enzymes for arginine catabolism (blue) or arginine biosynthesis (red).
- Heat map of expression changes for transcripts repressed over 2‐fold at 30 min in cells supplemented with arginine (EMM + R) relative to cells without supplementation (EMM). Values for timepoints 0 and 30 min after antimycin A addition are shown for cells grown in EMM, EMM with arginine and ssp1 deletion mutant grown in EMM. The data are normalised to EMM timepoint 0.
- Heat map of expression changes of the same genes as in (B) after 1 h of inhibiting TOR kinase with torin1 or caffeine/rapamycin treatment relative to cell before treatment; cells were grown in rich media—YES (data from (Rodríguez‐López et al, 2019)).
- Enriched and underrepresented amino acids in proteins encoded by 40 genes that are down‐regulated in media with arginine. Analysis performed using online tool AnGeLi (Bitton et al, 2015).
