Figure 7.
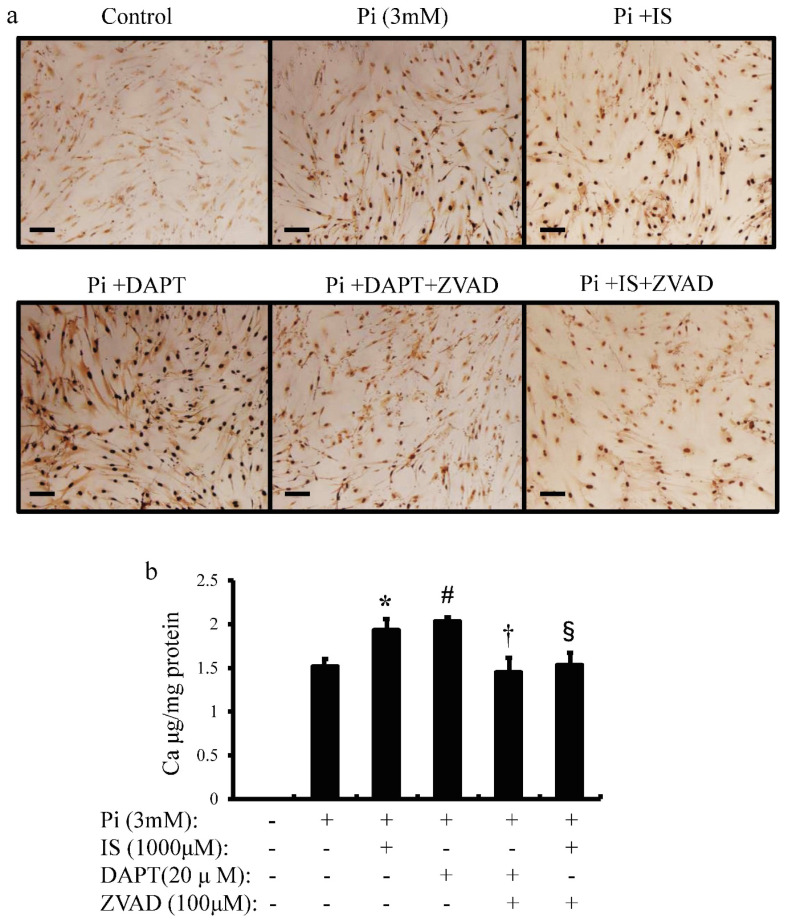
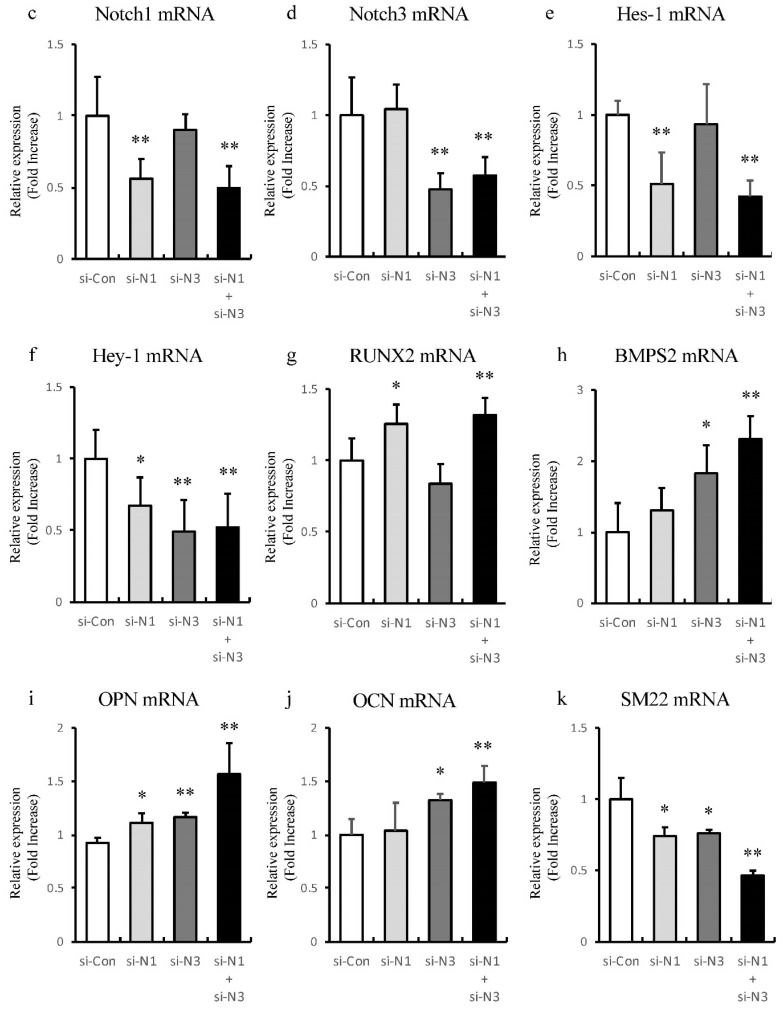
IS induces cellular calcium deposition in aortic SMCs. Calcium deposition in human aortic SMCs was induced by inorganic phosphate (3 mM). Cells were seeded at a density of 2×10⁵ cells/well on 12-well culture plate in D-MEM containing 10% FBS for 48 hrs. Cells were pre-incubated with DAPT (20 μM) and ZVAD (100 μM) for 1 hr, then stimulated with Pi (3 mM) or IS (1000 μM) for 72 hrs. Absorbance was measured at 570~650 nm using a microplate reader. (a) Representative images showing calcium deposition in IS- or Pi-treated human aortic SMCs (×200 magnification, bar=50 µm). (b) Quantitative analysis of calcium deposition in IS- and Pi-treated human aortic SMCs. Data are mean±SD (n=6 per group). *p<0.009 vs Pi (3 mM) group, #p<0.0008 vs Pi (3 mM) group, †p<0.0059 vs DAPT-treated group, § p<0.009 vs IS-treated group. Expression levels of Notch-related and osteogenic-related mRNA with single knockdown of Notch1 and 3 or double knockdown of Notch1/Notch3 in rat aortic SMCs was analyzed by quantitative RT-PCR. Data are mean ± SD (n=6-8 per group). (c) Notch1 (**p<0.01 vs si-control group) (d) Notch3 (**p<0.01 vs si-control group) (e) Hes-1 (**p<0.01 vs si-control group) (f) Hey-1 (*p<0.05 vs si-control group, **p<0.01 vs si-control group) (g) Runx2 (*p<0.05 vs si-control group, **p<0.01 vs si-control group) (h) BMPS2 (*p<0.05 vs si-control group, **p<0.01 vs si-control group) (i) osteopontin (OPN) (*p<0.05 vs si-control group, **p<0.01 vs si-control group) (j) osteocalcin (OCN) (*p<0.05 vs si-control group, **p<0.01 vs si-control group), and (k) SM22 (*p<0.05 vs si-control group, **p<0.01 vs si-control group).


