
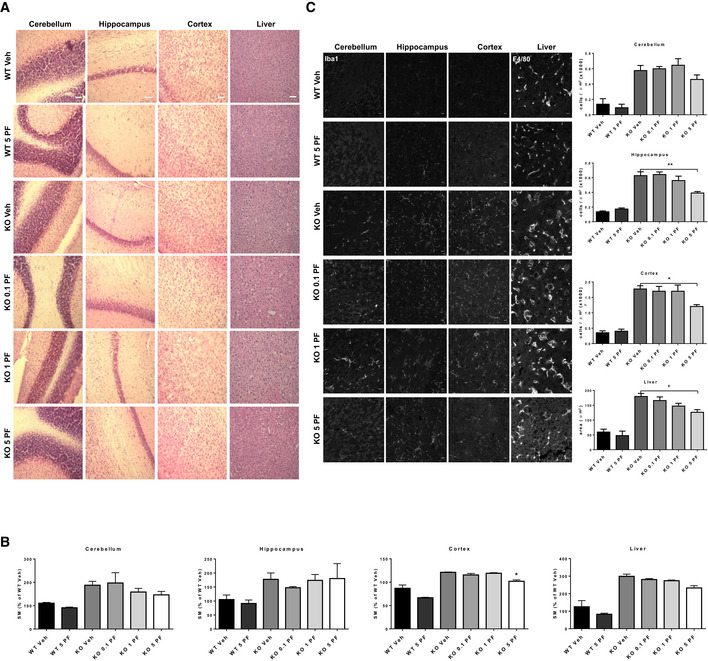
Figure 6. Acute oral treatment with PF at late disease stages is not toxic even at high doses.
-
AH&E staining of cerebellum, hippocampus, cortex, and liver from WT and ASM‐KO mice 48 h after one single administration of vehicle or the indicated doses of PF. Scale bar, 100 μm.
-
BMean ± SEM SM levels, expressed as percentage of vehicle values, in cerebellar, hippocampal, cortical, and liver extracts from WT and ASM‐KO mice 48 h after one single administration of vehicle or the indicated doses of PF. (*P KOVeh Vs KO 5 = 0.0304, n = 3 mice per group, one‐way ANOVA, Bonferroni post hoc)
-
CImmunofluorescences against the microglia marker Iba1 in the cerebellum, hippocampus, and cortex or against the macrophage marker F4/80 in the liver from WT and ASM‐KO mice 48 h after one single administration of vehicle or the indicated doses of PF. Graphs show mean ± SEM number of microglia per area unit in cerebellum, hippocampus, and cortex or mean ± SEM area of macrophages in the liver (hippocampus: **P KOVeh Vs KO 5 = 0.0015; cortex: *P KOVeh Vs KO 5 = 0.0364; liver: *P KOVeh Vs KO 5 = 0.0152, n = 6 mice per group, > 20 cells analyzed per mouse, one‐way ANOVA, Bonferroni post hoc). Scale bar, 10 μm.
Source data are available online for this figure.