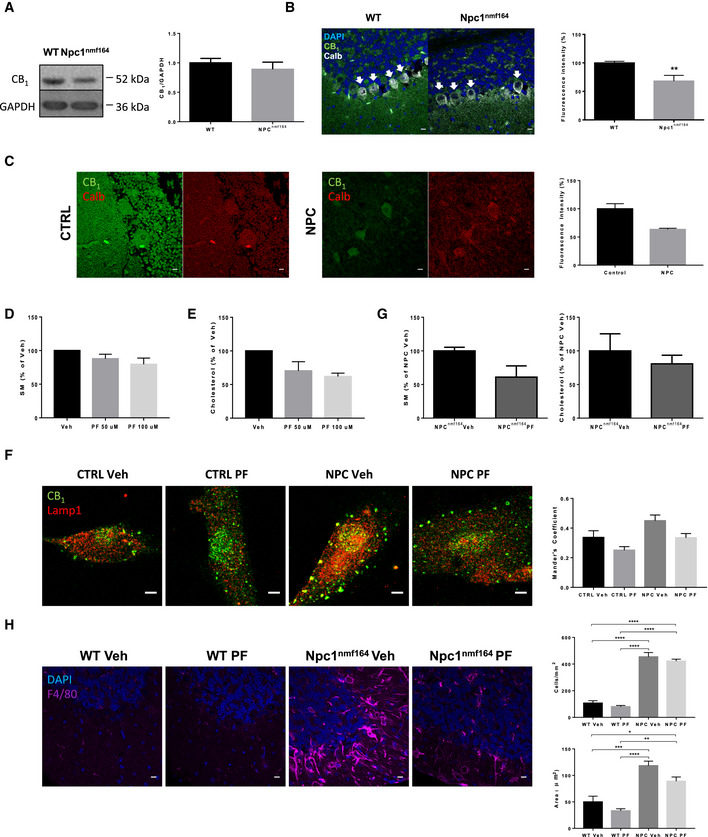
Figure 7. CB 1 levels are reduced in NPC mouse model and patient brains, and FAAHi prevents aberrant phenotypes in NPC cells and mouse model.

-
AWestern blot against CB1 and GAPDH (used as loading control) and graph showing mean ± SEM CB1 protein levels in cerebellar extracts from WT and Npc1nmf164 mice (n = 6).
-
BImmunofluorescence images against CB1 and calbindin in the cerebellum of WT and Npc1nmf164 mice. DAPI stains cell nuclei. Graphs show mean ± SEM intensity associated with CB1 in the Purkinje cells (indicated by arrows) expressed in arbitrary units (**P = 0.0085, n = 5 mice per group, Student's t‐test). Scale bar, 10 μm.
-
CImmunofluorescence images against CB1 in Purkinje cells of the cerebellum of age‐matched control and NPC‐affected children. Graph shows mean ± SEM intensity associated with CB1 in the Purkinje cells expressed as percentage of the control values (16 and 57 cells in control and NPC, respectively). Scale bar, 10 μm.
-
DGraph shows mean ± SEM SM levels, expressed as percentage of vehicle values, in cultured fibroblasts from a NPC patient treated with vehicle or with PF at 50 or 100 μM (n = 2 different cultures)
-
EGraph shows mean ± SEM cholesterol levels, expressed as percentage of vehicle values, in cultured fibroblasts from a NPC patient treated with vehicle or with PF at 50 or 100 μM (n = 2 different cultures)
-
FImmunofluorescence images of CB1 and Lamp1 in cultured fibroblasts from control subject and NPC patient treated with vehicle or with PF at 100 μM. Graph shows mean ± SEM Mander's coefficient for the co‐localization of CB1 with Lamp1 (n = 2 different cultures). Scale bar, 5 μm.
-
GGraphs show mean ± SEM SM and cholesterol levels expressed as percentage of the values obtained in the vehicle‐treated mice in the cerebellum of Npc1nmf164 after 48 h of a single dose of 5 mg/kg PF (n = 3 mice)
-
HImmunofluorescence images against the microglia marker F4/80 in the cerebellum of WT and Npc1nmf164 after 48 h of a single dose of 5 mg/kg PF. Graphs show mean ± SEM number (upper) and area (lower) of F4/80-positive cells (upper graph: ****P < 0.0001; lower graph: ***P WT Veh vs NPC Veh = 0.0008; *P WT Veh vs NPC PF = 0.0286; ****P WT PF vs NPC Veh < 0.0001; **P WT PF vs NPC PF = 0.0022, n = 3 mice per group, > 20 cells analyzed per mouse, one‐way ANOVA, Bonferroni post hoc). Scale bar, 10 μm.
Source data are available online for this figure.
