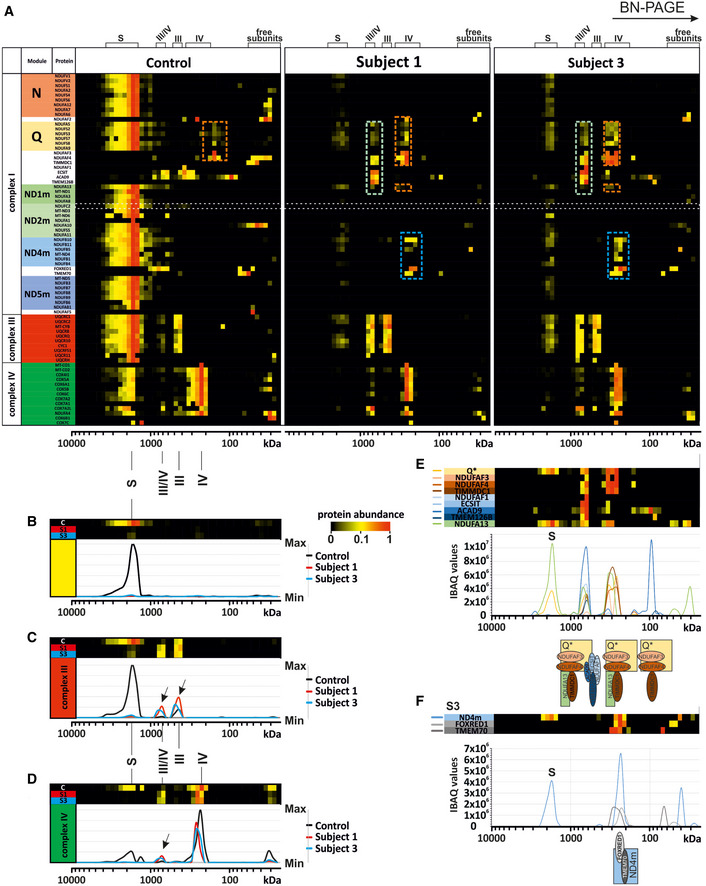
Figure 4. Complexome Profiling of Fibroblasts from Subjects 1 and 3 confirm complex I deficiency.

-
AComplexome profiling identified assembly intermediates in subject cells with NDUFC2 variants. Complexes from mitochondrial membranes of control, Subject 1 and Subject 3 fibroblasts were separated by BN‐PAGE (Fig EV2) and analysed by complexome profiling. Sample preparation, mass spectrometry, data processing and raw data have been deposited to the ProteomeXchange Consortium via the PRIDE partner repository (Vizcaíno et al, 2013) with the dataset identifier <PXD014936>. Assignment of complexes: III, complex III; IV, complex IV; III/IV, supercomplex containing dimer of complex III and 1–2 copies of complex IV; S, supercomplex containing complex I, dimer of complex III and 1–4 copies of complex IV. Assembly intermediates are highlighted in dashed boxes indicating stalled complex I assembly. In subject complexomes, various stalled complex I intermediates are assembled: ND4 module (blue dashed box); Q‐TIMMDC1‐NDUFA13 complex I intermediate (orange dashed box); and Q‐TIMMDC1‐NDUFA13‐MCIA (green dashed box). In control complexome, the Q module (orange dashed box) is assembled without TIMMDC1 or NDUFA13. Complex I modules are denoted according to Stroud et al (2016).
-
BAbundance data for all the subunits of complex I were averaged to plot an abundance profile of complex I. Heatmap (upper panel) and profile plot (lower panel) compare complex I between control (black), Subject 1 (red) and Subject 3 (blue).
-
CProfile plot of complex III (average of all subunits). Black arrows indicate shifted complex III to the position of the individual complex and small supercomplex (III/IV) in Subjects 1 and 3.
-
DProfile plot of complex IV (average of all subunits) indicate less complex IV at the position of the supercomplexes for Subject 1 and Subject 3, but higher amounts of individual complex IV and small supercomplex (III/IV, black arrow).
-
EDetails of Q module‐containing assembly intermediates of Subject 3. Intensity‐based absolute quantification (iBAQ) values of assembly factors, single subunit and averaged Q module subunits were plotted to show abundance profiles. The cartoon (lower panel) indicates assembled intermediate complexes relative to the plot.
-
FDetails about ND4 module assembly intermediate of Subject 3. Abundance profile of averaged iBAQ values of ND4 subunits and assembly factors show accumulation of a complex containing the ND4 module, FOXRED1 and TMEM70.
