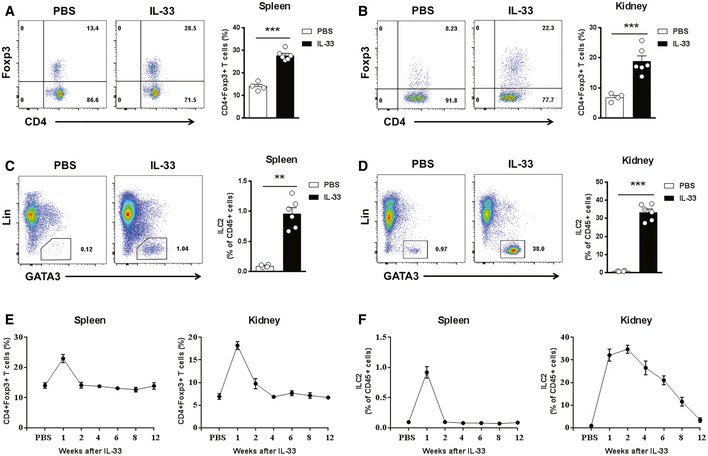
Figure 2. IL‐33 induced Tregs and ILC2s in vivo .

-
C57BL/6 mice were treated with mouse recombinant IL‐33 or PBS daily for 5 consecutive days.
-
A, BRepresentative FACS analysis showing the proportion of Tregs (CD4+Foxp3+) in the CD4+T‐cell compartment from the spleens (A) and kidneys (B) at day 3 after treatment in C57BL/6 mice receiving PBS (n = 4) or IL‐33 (n = 6).
-
C, DRepresentative FACS analysis showing the proportion of ILC2s (Lin‐GATA-3+) in the CD45+leukocyte compartment from the spleens (C) and kidneys (D) at day 3 after treatment in C57BL/6 mice receiving PBS (n = 4) or IL‐33 (n = 6).
-
E, Fproportion of Tregs (E) and ILC2s (F) in the spleen and kidney in PBS‐injected controls (n = 4) and at weeks 1–12 after IL‐33 treatment (n = 4–6 per IL‐33–treated group).
