-
A
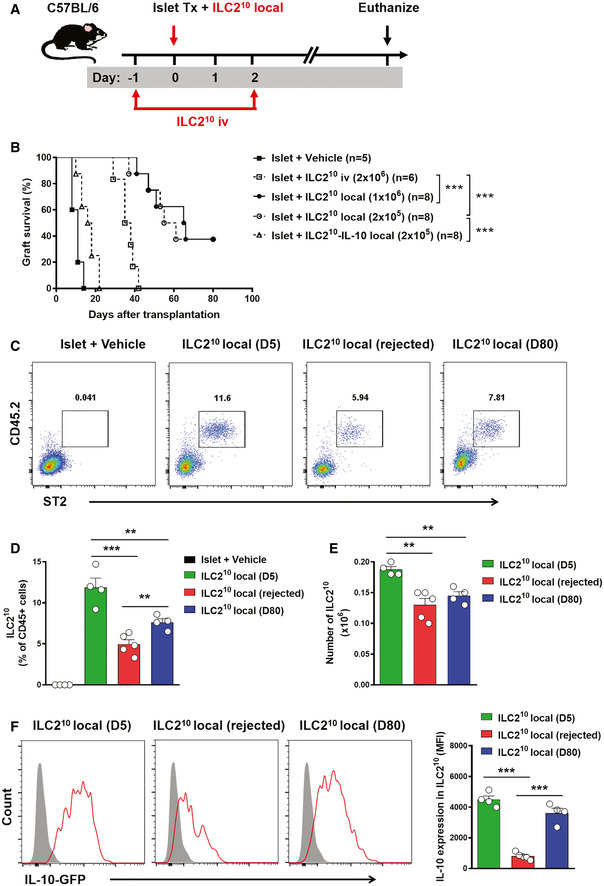
ILC210 were isolated from ex vivo‐expanded kidney ILC2s by flow sorting. ILC210 were co‐transplanted with islet locally or adoptively transferred into diabetic C57BL/6 mice twice at 1 day prior to and 2 days post‐islet transplantation. Mice were sacrificed at day 80 post‐islet transplantation or at the day when grafts were considered rejected.
-
B
Islet graft survival of five groups of mice was assessed by monitoring blood glucose and calculated using the Kaplan–Meier method. Cumulative data from two independent experiments are shown. Statistical analysis was performed with a log‐rank test. ***P < 0.001.
-
C
To track ILC210
in vivo, CD45.2+ILC210 were co‐transplanted with islets in diabetic CD45.1+C57BL/6 mice. Representative FACS analysis showing the proportion of locally transplanted ILC210 (CD45.2+ST2+) in the total CD45+ cell compartment from islet graft at day 5 and 80 post‐islet transplantation or at the day when grafts were considered rejected.
-
D, E
Proportion and numbers of locally transplanted CD45.2+ST2+ILC210 in islet grafts of islet transplant mice over time. Data shown are the mean ± SEM (n = 4–5 per group), and a one‐way ANOVA was performed, **P < 0.01, ***P < 0.001.
-
F
The expression of IL‐10-GFP was examined in locally transplanted CD45.2+ST2+ILC210 by flow cytometry. IL‐10-GFP (red lines) and controls (gray‐filled areas) are shown. Data represent the mean ± SEM of evaluations of MFI from each group (n = 4–5 per group), and a one‐way ANOVA was performed; ***P < 0.001. MFI, mean fluorescence intensity.

