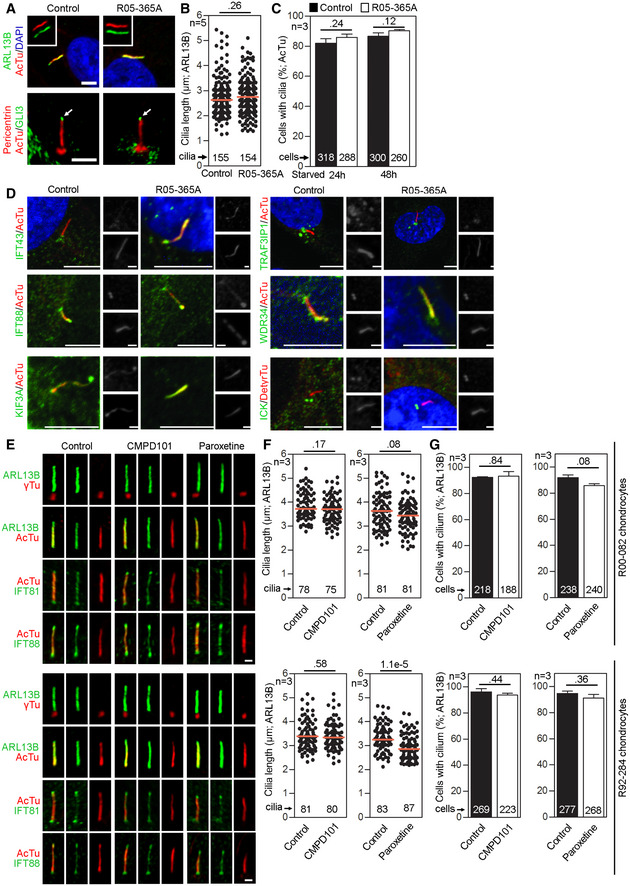
Figure EV1. GRK2 is not required for ciliogenesis or IFT .

-
A–CPrimary cilia are normal in GRK2 −/− fibroblasts. Cells were serum starved for 24 or 48 h to induce cilia, and (A) immunostained for acetylated tubulin (AcTu, red), ARL13B (green) (upper panel; insets show the individual signals), or AcTu (red), pericentrin (red) and GLI3 (green) (lower panel). Control and GRK2 −/− cilia were positive for AcTu and ARL13B, and showed similar localization of GLI3 to the tips (lower panel, arrows). Acetylated tubulin and pericentrin staining were used to visualize the axoneme and centrioles, respectively. Scale bar, 2 μm. (B) Length distribution of cilia did not differ between control and GRK2 −/− cells. Red bars show medians; dots represent individual cilia. Mann–Whitney U test; number of biological experiments and the total numbers of analyzed cilia are indicated. (C) There was no difference in the efficiency of ciliogenesis between control and GRK2 −/− cells. Mean ± SEM. Welch's t‐test; number of biological experiments and the total numbers of analyzed cells are indicated.
-
DLoss of GRK2 did not affect localization of ciliary and IFT components. Immunofluorescence of serum‐starved (48 hr) control and GRK2 −/− fibroblasts immunostained with AcTu or detyrosinated tubulin (DetyrTu) to mark the cilium (red), and IFT43, IFT88, KIF3A, TRAF3IP1, WDR34, or ICK (green). No significant differences in staining were found between control and GRK2 −/− cilia, suggesting normal IFT. Scale bars, 5 μm and 1 μm (insets).
-
E–GInhibition of GRK2 activity did not affect primary cilia in chondrocytes. (E) Control human R92‐284 and R00‐082 chondrocytes were serum starved in the presence of a GRK2 inhibitor, either 20 μM CMPD101 or 10 μM paroxetine, for 24 h before they were fixed and immunostained for cilia (ARL13B; gamma tubulin, γTu; acetylated tubulin, AcTu) and the retrograde IFT‐B proteins IFT81 or IFT88. Scale bar, 1 μm. (F) Cilia length was measured using the ARL13B signal. Red bar, median. Mann–Whitney U‐test; number of biological experiments and total cilia numbers are indicated. (G) The percentage of ciliated cells was calculated. Mean ± SEM. Welch's t‐test; number of biological experiments and total cell numbers are indicated.
Source data are available online for this figure.
