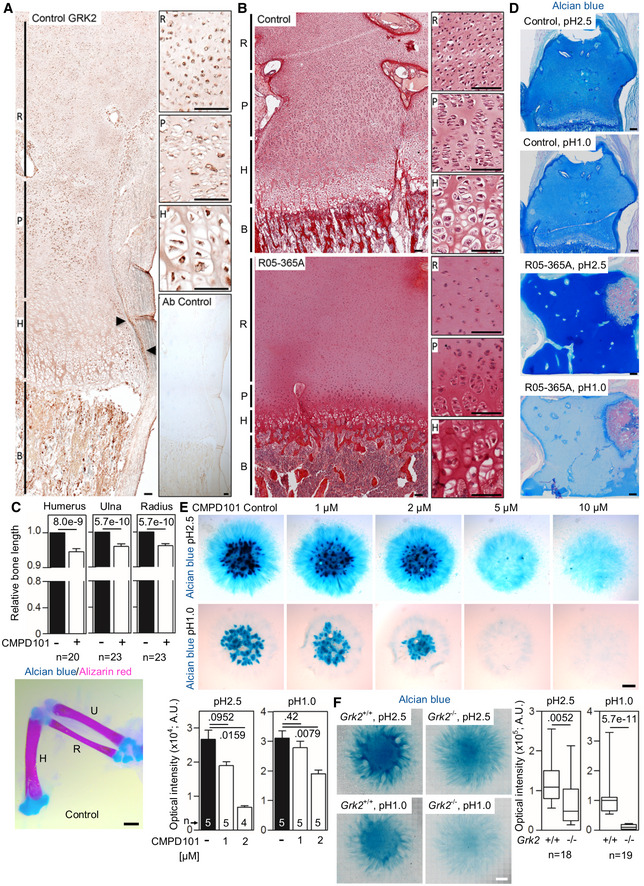
Figure 3. GRK2 is essential for skeletal growth plate development.

-
AGRK2 immunohistochemistry in a control 17‐week gestational age distal femur growth plate demonstrating widespread expression, particularly in the bone (B), proliferating zone of the growth plate (P), and the perichondrium (arrowheads). Non‐reactive antibody was used as a control (Ab control). R, reserve zone. H, hypertrophic zone. Scale bars, 100 μm.
-
BPicrosirius red staining of the femoral growth plates of a control and the ATD R05‐365A fetus. The control growth plate shows normal architecture with clearly distinguishable reserve (R), proliferating (P) and hypertrophic (H) zones. A profound disruption of growth plate architecture is obvious in the GRK2 −/− growth plate, which shows irregularly shaped reserve zone chondrocytes, a lack of discernable proliferating chondrocytes, and a significantly under‐developed hypertrophic zone. Scale bars, 100 μm.
-
CShortened long bones in the chicken wings injected with CMPD101. The right limb bud was injected with CMPD101, and the left one was left as a control. Note the shortened humerus (H), ulna (U), and radius (R) in the CMPD101‐injected wing. Mean ± SEM. Mann–Whitney U‐test; number of animals is indicated. Scale bar, 150 μm.
-
DAlcian blue staining of the femoral growth plates of a control and the ATD R05‐365A fetus. Note the significantly lesser blue staining of the R05‐365A growth plate stained by alcian blue pH 1.0, suggesting impaired sulfation of the extracellular matrix. Scale bars, 200 μm.
-
EAlcian blue staining of the chicken limb bud micromasses treated with CMPD101. Note the gradual inhibition of the cartilage nodules with increasing concentration of CMPD101, quantified below. Mean ± SEM. Mann–Whitney U‐test; number of micromasses is indicated. A representative experiment of four (pH 2.5) and three (pH 1.0) is shown. Scale bar, 100 μm.
-
FAlcian blue staining of the micromasses generated from Grk2 +/+ and Grk2 −/− NIH3T3 cells. Note the mildly weaker staining by alcian blue pH 2.5 and the nearly absent sulfation stained by alcian blue pH 1.0 in the Grk2 −/− micromasses. Central band, median. Box, 1st‐3rd quartile. Whiskers, 10%‐90% percentile. Mann–Whitney U‐test; number of micromasses is indicated. Scale bar, 1 mm.
Source data are available online for this figure.
