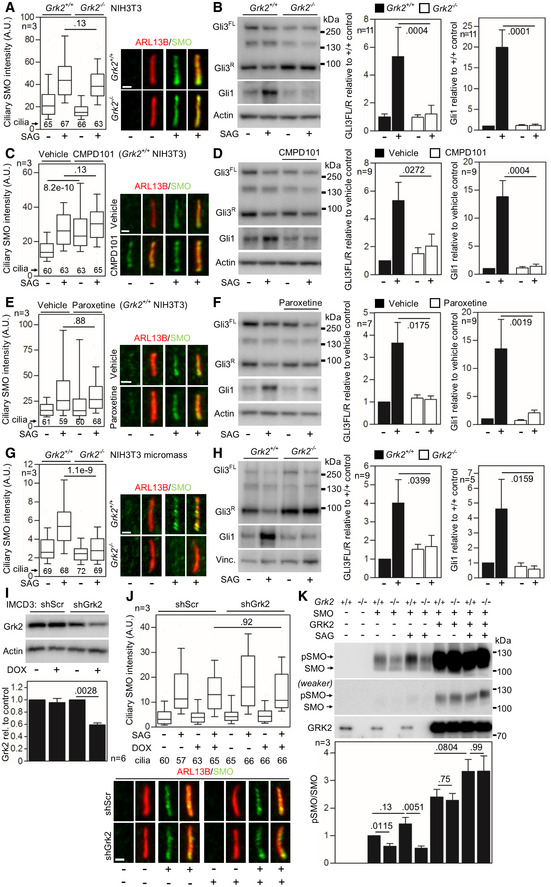
Figure EV3. Loss of Grk2 protein or its activity does not prevent ciliary SMO accumulation in the murine NIH3T3 cells.

-
ASerum‐starved Grk2 +/+ and Grk2 −/− NIH3T3 cells were treated with 500 nM SAG for 4 h; the cells were immunostained for ARL13B and SMO, and the intensity of ciliary SMO was analyzed and plotted. Note the normal ciliary SMO intensity in Grk2 −/− cells. Central band, median. Box, 1st–3rd quartile. Whiskers, 10–90% percentile. Mann–Whitney U test; number of biological experiments and the total numbers of analyzed cilia are indicated. Scale bars, 1 μm.
-
BSerum‐starved Grk2 +/+ and Grk2 −/− NIH3T3 cells were treated with 500 nM SAG for 10–16 h, and immunoblotted for Gli3 and Gli1. The optical density of the bands was normalized to that of actin, and the Gli3‐FL/R ratios and Gli1 protein levels were plotted. Mean ± SEM. Mann–Whitney U‐test; number of biological experiments is indicated. Gli3FL and Gli3R, full‐length and repressor GLI3 variants, respectively.
-
C–FGrk2 +/+ NIH3T3 cells were serum starved together with 25 μM CMPD101 (C, D) or 1 μM paroxetine (E, F) for 12 h, and treated with 500 nM SAG for 4 hours (C, E) or 12 h (D, F). (C, E) Inhibition of Grk2 activity by neither CMPD101 nor paroxetine prevents the SAG‐induced ciliary SMO accumulation. Central band, median. Box, 1st–3rd quartile. Whiskers, 10%–90% percentile. Mann–Whitney U test; number of biological experiments and the total numbers of analyzed cilia are indicated. Scale bars, 1 μm. (D, F) CMPD101 and paroxetine inhibit SAG‐mediated Gli3 processing and Gli1 upregulation. Mean ± SEM. Mann–Whitney U test; number of biological experiments is indicated.
-
G, HMicromasses derived from Grk2 +/+ and Grk2 −/− NIH3T3 cells were serum starved, treated, and analyzed as in (C–F). (G) Note the inhibition of ciliary SMO intensity in Grk2 −/− micromasses. Central band, median. Box, 1st–3rd quartile. Whiskers, 10%–90% percentile. Mann–Whitney U‐test; number of biological experiments and the total numbers of analyzed cilia are indicated. Scale bars, 1 μm. (H) Western blots for Gli3 processing and Gli1 upregulation. Mean ± SEM. Mann–Whitney U‐test; number of biological experiments is indicated. Vinc., vinculin.
-
I, JNormal SMO cilia accumulation in murine IMCD3 cells with downregulated Grk2. (I) Doxycycline (DOX)‐inducible Grk2 downregulation, tested by Western blot, normalized to actin and plotted below. Mean ± SEM. Mann–Whitney U‐test; number of biological experiments is indicated. shScr, scramble shRNA. (J) Cells pre‐treated with DOX for 3 days were serum starved, SAG treated, stained, and analyzed as in (A), and the intensity of ciliary SMO was analyzed and plotted. Note the normal SMO accumulation in cilia in cells with Grk2 downregulation. Central band, median. Box, 1st–3rd quartile. Whiskers, 10%–90% percentile. Mann–Whitney – test; number of biological experiments and the total numbers of analyzed cilia are indicated. Scale bar, 1 μm.
-
KUnder‐phosphorylation of SMO in Grk2 −/− NIH3T3 cells. Lysates of SMO‐transfected cells were resolved by the phospho(p)‐shift PAGE and immunoblotted for SMO. The portion of pSMO analyzed by densitometry is shown. GRK2 add‐back demonstrates a rescue of the pSMO in Grk2 −/− cells. Mean ± SEM. Welch's t‐test; number of biological replicates is indicated.
Source data are available online for this figure.
