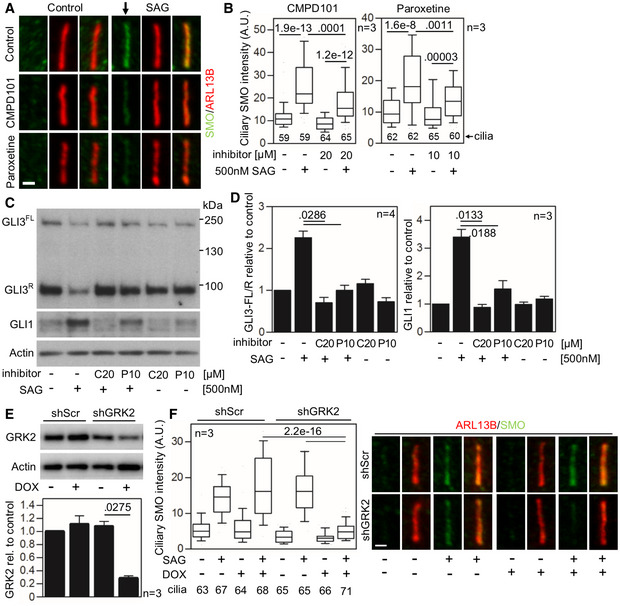
Figure 5. Inhibition of GRK2 activity decreases Smoothened accumulation in cilia and GLI3 processing.

-
A–DDefective SMO cilia accumulation and inhibited Hh signaling in chondrocytes treated with GRK2 inhibitors. Control human R00‐082 chondrocytes were serum starved in the presence of a GRK2 inhibitor, either CMPD101 (C) or paroxetine (P), for 24 h before they were treated with SAG for additional 12 (A, B) or 24 h (C, D). (A,B) Cilia were stained by ARL13B and SMO antibodies, and the intensity of ciliary SMO was analyzed and plotted. Note the impaired SMO accumulation in cilia caused by GRK2 inhibition (black arrow). Central band, median. Box, 1st‐3rd quartile. Whiskers, 10%‐90% percentile. Mann–Whitney U test; number of biological experiments and the total numbers of analyzed cilia are indicated. Scale bar, 1 μm. (C) Cell lysates were immunoblotted for GLI3 processing and GLI1 upregulation; actin levels served as a loading control. GLI3FL and GLI3R, full‐length, and repressor GLI3 variants, respectively. (D) Quantification of GLI3 and GLI1 levels by densitometry. Note the impaired GLI3 processing and no GLI1 upregulation in cells treated with CMPD101 or paroxetine. Mean ± SEM. Mann–Whitney U‐test (GLI3 ratio) and Welch's t‐test (GLI1 levels); number of biological experiments is indicated.
-
E, FDefective SMO cilia accumulation in chondrocytes with downregulated GRK2. (E) Doxycycline (DOX)‐inducible GRK2 downregulation in control human R00‐082 chondrocytes, tested by Western blot, normalized to actin, and plotted below. Mean ± SEM. Welch's t‐test; number of biological experiments is indicated. shScr, scramble shRNA. (F) Cells pre‐treated with DOX for three days were serum starved, SAG treated, stained, and analyzed as in (A,B), and the intensity of ciliary SMO was analyzed and plotted. Note the impaired SMO accumulation in cilia caused by GRK2 loss. Central band, median. Box, 1st‐3rd quartile. Whiskers, 10%‐90% percentile. Mann–Whitney U test; number of biological experiments and the total numbers of analyzed cilia are indicated. Scale bar, 1 μm.
Source data are available online for this figure.
