
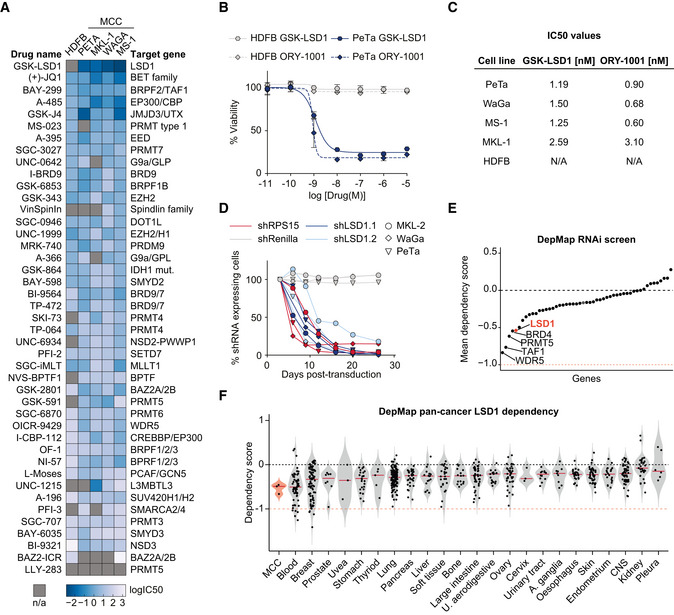
Figure 1. LSD1 is required for Merkel cell carcinoma proliferation.
-
AHeatmap of IC50 values for cell viability. Human dermal fibroblasts (HDFB) controls and four MCC cell lines (PeTa, MKL‐1, WaGa, and MS‐1) were treated with the 43 indicated small molecules targeting epigenetic modifiers. IC50 values are depicted as log10(IC50) in (mM). n/a, IC50 values could not be calculated. n = 4 technical replicates.
-
BDose–response curves of PeTa cells and control HDFB cells after 6 days of treatment with GSK‐LSD1 or ORY‐1001. Dose–response curves of three other MCC cell lines are displayed in Fig EV1A. n = 4 technical replicates. Data are represented as means ± SD.
- C
-
DIn vitro competition assay of the three MCC cell lines MKL‐2, PeTa, and WaGa transduced with either shLSD1.1, shLSD1.2, shRenilla (negative control), or shRPS15 (positive control). Individual graphs are displayed in Fig EV1E.
-
EDependency plot depicting the mean dependency of the three MCC cell lines PeTa, MKL‐1, and MKL‐2 of the genes targeted by the compound library in Fig 1A. A score of 0 indicates that a gene is not essential; correspondingly −1 is comparable to the median of all pan‐essential genes. Data obtained from DepMap; dependencies for the individual cell lines are displayed in Fig EV1F.
-
FViolin plot depicting the LSD1 dependency score in MCC compared to cancer types from 23 tissues, ordered according to mean dependency score. Red horizontal line depicts the median. Data obtained from DepMap RNAi screen. Blood, hematopoietic and lymphoid tissue; U. aerodigestive, upper aerodigestive tract; A. ganglia, autonomic ganglia; CNS, central nervous system.
Source data are available online for this figure.