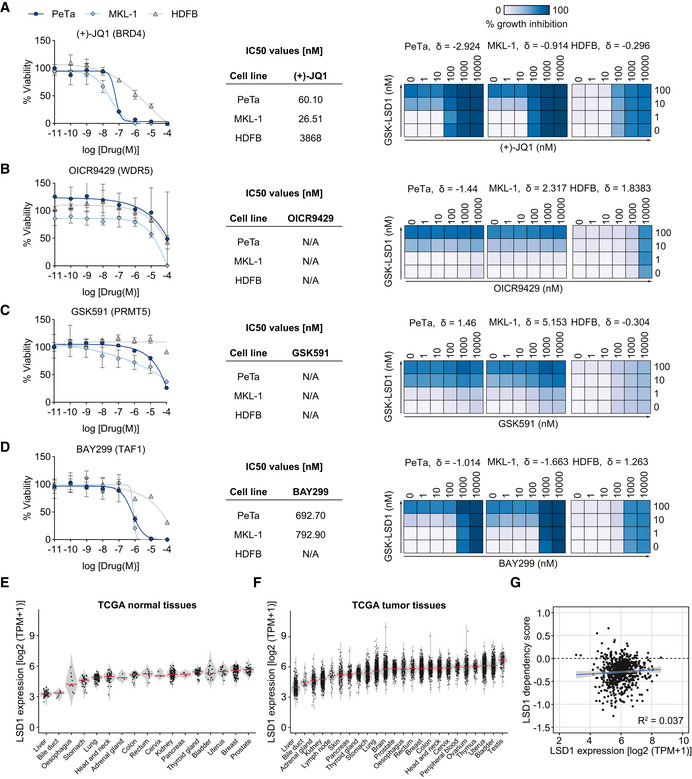
Figure EV2. Inhibition of the ubiquitously expressed demethylase LSD1 is unprecedented in specificity and selectivity in MCC .

-
A–DLeft. Dose–response curves for viability of two MCC cell lines (PeTa and MKL‐1) and control HDFB cells after 6 days of treatment. n = 4 technical replicates. Data are represented as means ± SD. Middle. IC50 values for reduced growth of PeTa, MKL‐1, and HDFB controls. Right. Bliss synergy score (δ) matrices depicting the percentage of synergistic growth inhibition in PeTa, MKL‐1, and HDFB control cells upon combined treatment of GSK‐LSD1 and other compounds. A positive score (δ > 0) indicates a synergistic effect, whereas a negative score (δ < 0) indicates an antagonistic effect.
-
EViolin plot depicting the LSD1 expression in 17 normal tissues, ordered according to mean. Red horizontal line depicts the median. Data obtained from TCGA. TPM, transcripts per million.
-
FViolin plot depicting the LSD1 expression in 24 tumor tissues, ordered according to mean. Red horizontal line depicts the median. Data obtained from TCGA. TPM, transcripts per million.
-
GCorrelation plot of LSD1 expression against LSD1 dependency (RNAi screen) in various cancer types. Data obtained from DepMap RNAi and expression dataset. Blue line indicates linear regression. R 2, Pearson correlation coefficient; slope = 0.021; intercept = −0.421; P = 0.118; TPM, transcript per million.
Source data are available online for this figure.
