
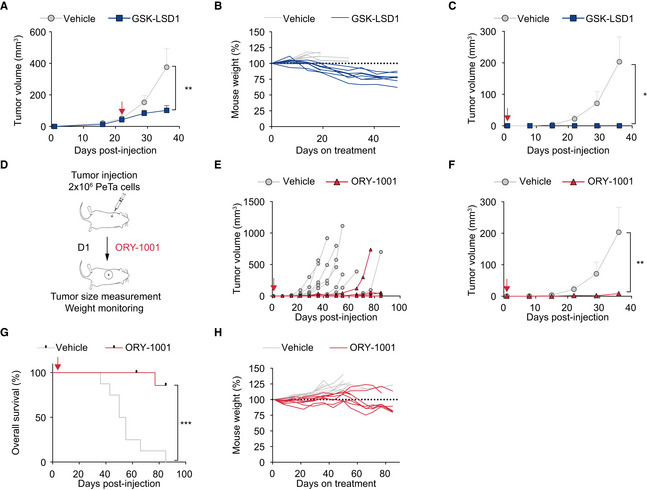
Figure EV3. Pharmacological LSD1 inhibition controls tumor growth in vivo .
-
ATreatment response of subcutaneous tumors in mice treated with GSK‐LSD1 (n = 9) or vehicle (n = 8). Red arrow, start of therapy, day 22. Data are represented as means ± SEM. **P = 0.0025 (Mann–Whitney test).
-
BMouse weight (%) during treatment of GSK‐LSD1 (n = 9) or vehicle‐treated (n = 8) mice relative to weight at treatment start (D22).
-
CTreatment response of subcutaneous tumors treated with GSK‐LSD1 (n = 8) or vehicle (n = 8). Red arrow, start of therapy, day 1. Data are represented as means ± SEM. *P = 0.0363 (unpaired Student's t‐test with Welch's correction).
-
DSchematic depicting the experimental setup for in vivo xenograft tumor treatment with ORY‐1001 in NSG mice. ORY‐1001 or vehicle treatment was started 1 day after tumor injection (D1).
-
EIndividual tumor growth with ORY‐1001 (n = 8) or vehicle‐treated (n = 8) mice. Red arrow, start of therapy, day 1.
-
FTreatment response of subcutaneous tumors treated with ORY‐1001 (n = 8) or vehicle (n = 8). Red arrow, start of therapy, day 1. Data are represented as means ± SEM. **P = 0.0087 (Mann–Whitney test).
-
GKaplan–Meier curve of ORY‐1001 (n = 8) or vehicle‐treated (n = 8) mice. Mice were sacrificed when tumors reached a volume ≥ 1.5 cm3 or greatest dimension was ≥ 1.5 cm. Red arrow, start of therapy, day 1. ***P < 0.0001 (log‐rank Mantel–Cox test).
-
HRelative mouse weight (%) during treatment of ORY‐1001 (n = 8) or vehicle‐treated (n = 8) mice.
Source data are available online for this figure.