
Figure EV4. LSD1 inhibition induces marked transcriptional changes.
-
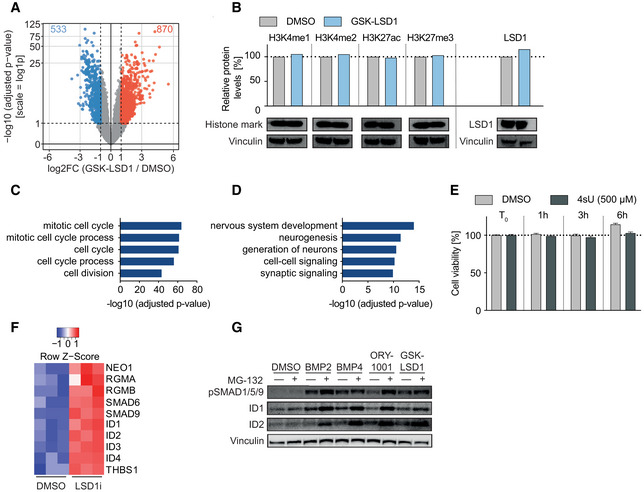
AVolcano plot showing the −log10 (adjusted P‐value) and log2 fold change (log2FC) for transcripts detected by RNAseq analysis of PeTa cells treated with 100 nM GSK‐LSD1 or DMSO for 6 days. Significantly up‐ and downregulated genes (FDR ≤ 0.05; abs[log2FC] ≥ 1) are marked in red and blue, respectively.
-
BImmunoblot analysis for histone marks and LSD1 upon GSK‐LSD1 and protein level quantification normalized to loading control (vinculin) and relative to DMSO control.
-
CPathway enrichment analysis (GO:BP) of 533 significantly downregulated genes upon GSK‐LSD1 treatment displayed in Fig 4D.
-
DPathway enrichment analysis (GO:BP) of 870 significantly upregulated genes upon GSK‐LSD1 treatment displayed in Fig 4F.
-
ECell viability (%) upon 4‐thiouridine (4sU) treatment in PeTa cells over time relative to treatment start (T 0). Data are represented as means ± SD.
-
FHeatmap depicting the transcriptional activation of members of TGFβ signaling after 24‐h treatment with LSD1i.
-
GImmunoblot probing for protein levels of phospho‐SMAD1/5/9, ID1, and ID2 in PeTa cells treated with indicated compounds for 24 h. Vinculin serves as loading control.
Source data are available online for this figure.