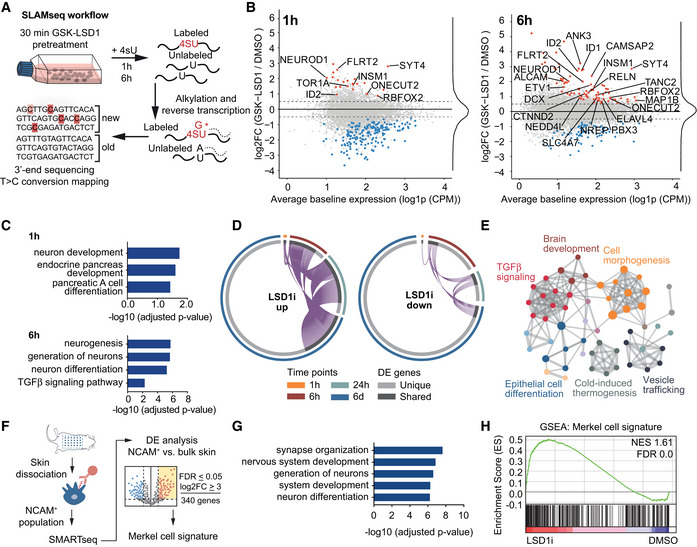
Figure 5. LSD1 directly represses transcription of key regulators of the neuronal lineage.

-
ASchematic of SLAMseq workflow. Cells were pre‐treated for 30 min with LSD1 inhibitor (100 nM GSK‐LSD1), and newly synthesized RNA was subsequently labeled for 1 or 6 h with 4‐thiouridine (4sU). RNA was extracted and alkylated and subjected to 3′‐end RNA sequencing.
-
BMA plot of the mRNA changes detected by SLAMseq after 1 and 6 h of 4sU labeling. Significantly up‐ and downregulated genes (FDR ≤ 0.05; abs [log2FC] ≥ 0.5) are marked in red and blue, respectively. Genes belonging to neuronal differentiation (GO:0048666) are labeled. FC, fold change; CMP, counts per million.
-
CPathway enrichment analysis for upregulated (FDR ≤ 0.05; log2FC ≥ 0.5) direct transcriptional targets of LSD1 in Fig 5B.
-
DCircos plots depicting the transcriptional changes of genes up‐ (up) and downregulated (down) upon LSD1i after 1 h, 6 h, 24 h, and 6 days. DE, differentially expressed.
-
EMetascape analysis of upregulated genes for enriched pathway terms in genes identified after 6 h of 4sU‐labeling. Major pathway clusters are labeled.
-
FSchematic of Merkel cell extraction and Merkel cell signature generation. DE, differential expression; FDR, false discovery rate; log2FC, log2 fold change.
-
GPathway enrichment analysis (GO:BP) of genes upregulated in Merkel cell signature.
-
HGene set enrichment analysis (GSEA) of the generated Merkel cell signature on the data in Fig 4B. NES, normalized enrichment score; FDR, false discovery rate.
Source data are available online for this figure.
