
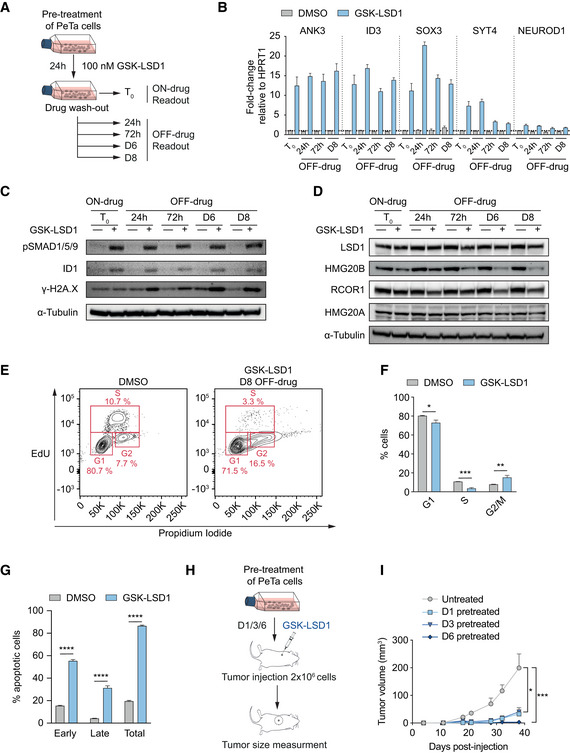
Figure 7. Pharmacological LSD1 inhibition induces a sustained change in cell fate.
-
ASchematic of drug pulse and wash‐out experiment. PeTa cells were treated with 100 nM GSK‐LSD1 or DMSO. After 24 h, a cell sample was harvested (T 0, ON‐drug) and the remaining cells were washed and changed into fresh medium without drug. Additional cell samples were taken 24 h, 72 h, 6 days (D6), and 8 days (D8) after drug wash‐out (OFF‐drug) for downstream readouts.
-
BRT–qPCR quantification of neuronal genes at the different time points and conditions depicted in Fig 7A. Data are relative to the housekeeping gene HPRT1 and normalized to the respective DMSO control. n = 4 technical replicates. Bar graphs represent mean ± SD.
-
CImmunoblot probing for sustainability of LSD1 activity inhibition at the different time points and conditions depicted in Fig 7A. α‐Tubulin serves as loading control. pSMAD1/5/9, phospho‐SMAD1/5/9.
-
DImmunoblot probing for LSD1‐CoREST complex members at the different time points and conditions depicted in Fig 7A. α‐Tubulin serves as loading control.
-
ERepresentative FACS readout of EdU/propidium iodide cell cycle staining of PeTa cells 8 days after drug wash‐out.
-
FQuantification of EdU/propidium iodide staining depicted in Fig 7E. n = 3 biological replicates. Data are represented as means ± SD. *P < 0.05, **P < 0.01; ***P < 0.001 (G1 phase: DMSO vs GSK‐LSD1 P = 0.0104; S phase: DMSO vs GSK‐LSD1 P = 0.0001; G2/M phase: DMSO vs GSK‐LSD1 P = 0.0062; unpaired Student's t‐test).
-
GQuantification of FACS Annexin V/DAPI staining of PeTa cells 8 days after drug wash‐out. n = 3 biological replicates. Data are represented as means ± SD. ****P < 0.0001 (unpaired Student's t‐test).
-
HSchematic depicting the experimental setup of the in vivo tumor growth of pre‐treated cells. PeTa cells were pre‐treated in vitro with 100 nM GSK‐LSD1 for 1, 3 or 6 days, or DMSO treated for 6 days prior injection.
-
ISubcutaneous tumor growth of pre‐treated cells (untreated, n = 8; D1, n = 9; D3, n = 9; D6, n = 4). Data are represented as means ± SEM. *P < 0.05, ***P < 0.001 (untreated vs D1 P = 0.023; untreated vs D3 P = 0.023; untreated vs D6 P = 0.0007; Kruskal–Wallis test).
Source data are available online for this figure.