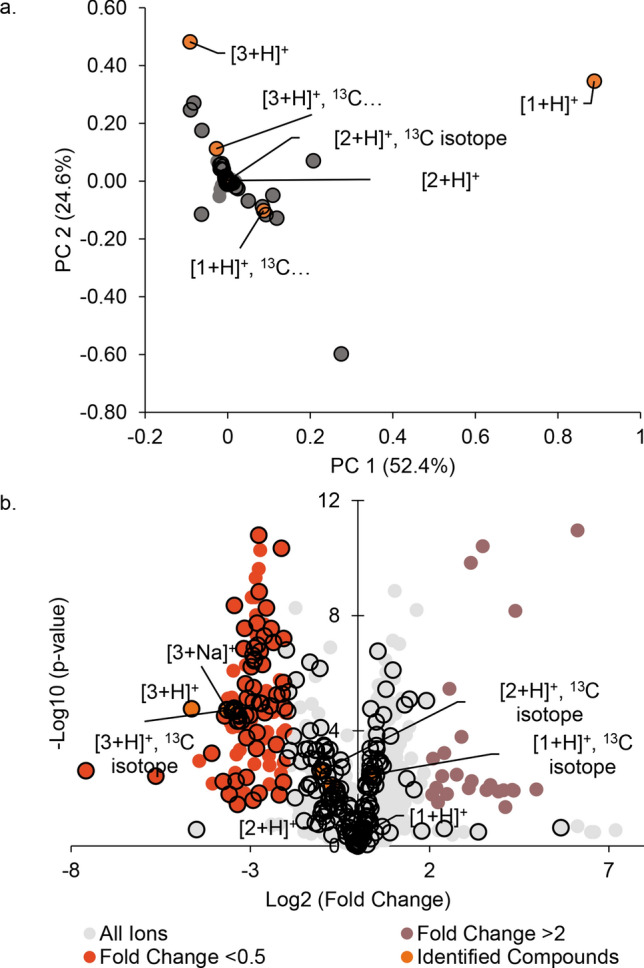
Figure 3.

Plots of significant features based upon the PCA analysis. (A) Loadings plot, where the spatial arrangement of the features (unique m/z-RT pairings) corresponds to the distribution of the samples (i.e., scores plot, Fig. 2). Speciofoline (3) appears to be a feature that is responsible for discriminating between the two sample groupings along the y-axis (PC2). (B) Volcano plot, highlighting significant features of the metabolites based on statistical testing (p value < 0.05, fold change > 2 or < 0.5) between the two groupings, with the further a feature’s position away from the origin (0, 0), the more significant the feature is. The speciofoline-rich group (red circles) yielded 120 significant features, while 19 features were significantly distinct in the non-speciofoline-rich grouping of commercial samples (purple circles). Speciofoline (3) was found to be a metabolite that differed significantly across sample groups, while mitragynine (1) and 7-hydroxymitragynine (2) were not significantly different between the two groups (orange circles). Other features predicted to be alkaloids based on mass defect (open circles). Labels on plot refer to the compound number and the type of ion observed (i.e.[3 + H]+ refers to the protonated molecule of speciofoline).
