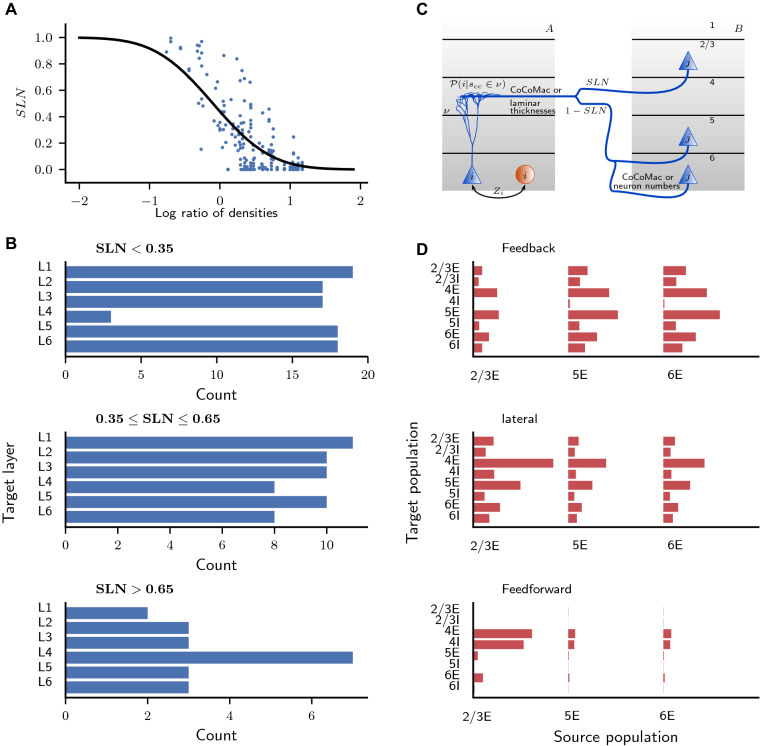
Fig. 5.
Layer- and population-specific cortico-cortical connection patterns. a Fraction of source neurons in supragranular layers (SLN) vs. logarithmized ratio of the overall neuron densities of the two areas. SLN from Markov et al. (2014), neuron densities from Hilgetag et al. (2016). Black curve, fit using a beta-binomial model (Eq. (1); ). b Laminar target patterns of synapse locations in relation to the SLN value of the source pattern. Target patterns are taken from the CoCoMac database (Felleman and Van Essen 1991; Barnes and Pandya 1992; Suzuki and Amaral 1994; Morel and Bullier 1990; Perkel et al. 1986; Seltzer and Pandya 1994) and SLN data from Markov et al. (2014) mapped to the FV91 scheme. c Illustration of the procedure (Supplementary Eq. 3) for distributing synapses across layers and populations. A source neuron from population j in area B sends an axon to layer v of area A where a cortico-cortical synapse is formed at the dendrite of a neuron from population i. The dendritic morphology is from Mainen and Sejnowski (1996) (source: NeuroMorpho.org; Ascoli et al. 2007). d Laminar patterns of cortico-cortical connections in the feedback, lateral, and feedforward direction, measured as the indegree of the population pairs divided by the sum of indegrees over all pairs, and then averaged across area pairs with the respective connection type (). The categorization into feedback, lateral, and feedforward types follows the SLN value as in B

