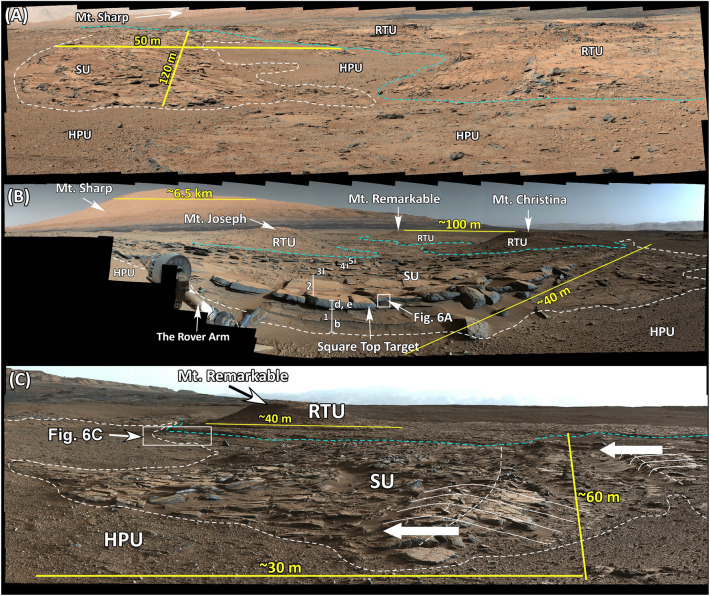
Figure 4.
(A) Mastcam image mosaic (Mcam02230) acquired on Sol 551 (looking east) shows one of the patches of the SU and its south-dipping layers. This patch is 120 m along the strike direction and 50 m along the dip direction. The SU overlies the HPU with a sharp contact shown in white dashed line. The RTU overlies the SU and the HPU shown by the dashed cyan line. (B) Mastcam image mosaic (Mcam02407) acquired on Sol 580 (see Fig. 1D for location) shows another patch of the SU. This patch is 120 m along the strike direction and 100 m along the dip direction. The SU layers dip southward. The dashed white line shows the contact between the SU and the HPU. The dashed cyan line shows the base of the RTU and its contact with the SU and the HPU. (C) Mastcam image (mcam02484) acquired on Sol 590 shows the relationships between the HPU, the SU, and the RTU at the Kimberley region (see Fig. 1D for location). The view is toward the west. The SU overlies the HPU with a sharp contact shown with a dashed white line. The RTU overlies the SU and the HPU also with a sharp contact shown in dashed cyan line. Thin solid white lines mark secondary dunes formed in the SU. These dunes are between 30 and 150 cm high. White arrows show the inferred dune migration developed on layers of the SU. Images used to generate these mosaics are publically available at the Planetary Data System web site at https://pds-imaging.jpl.nasa.gov/ (see supplemental documents). Credit: Malin Space Science Systems and NASA/JPL.

