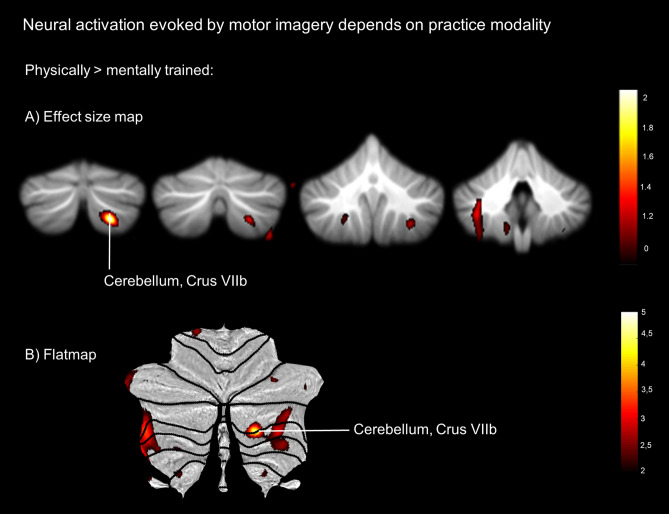
Figure 3.
Neuroimaging Results. Significantly stronger activation in physically compared to mentally trained sequences (p < 0.05, FWE-corrected). (A) Effect size maps using Cohen’s d for the contrast of Physical > Mental. Effect sizes were thresholded at d = 1.0. (B) Flatmap depicting a flat representation of the human cerebellar cortex with a projection of the T map of the contrast Physical > Mental. T map was thresholded at t = 2.5.

