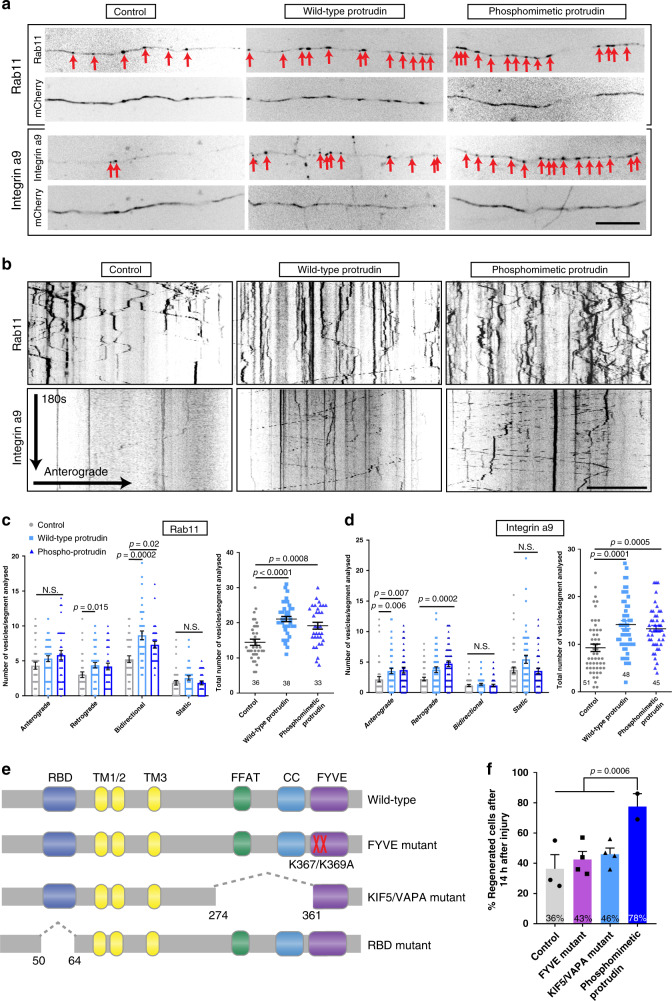
Fig. 3. Protrudin enhances the transport of growth machinery and receptors in the distal axon, and its involvement in axon transport is required for axon regeneration.
a Representative distal axon sections of neurons expressing integrin α9-GFP or Rab11-GFP, together with either mCherry (control), mCherry-wild-type Protrudin or mCherry-phosphomimetic Protrudin. Scale bar is 20 µm. b Kymographs showing the dynamics of integrin α9-GFP and Rab11-GFP in distal axons of co-transfected neurons. Scale bar is 10 µm. c Quantification of Rab11-GFP axon vesicle dynamics and total number of Rab11 GFP vesicles in distal axon sections (n = 3 independent experiments) (for transport, Kruskal–Wallis with Dunn’s multiple comparison test was used; anterograde—p = 0.175, Kruskal–Wallis statistic = 3.489; retrograde—p = 0.02, Kruskal–Wallis statistic = 8.197, bidirectional—p = 0.0002, Kruskal–Wallis statistic = 16.60, static—p = 0.105, Kruskal–Wallis statistic = 4.499; for total number of vesicles, one-way ANOVA was used—p < 0.0001, F statistic = 15.68). Error bars represent mean ± SEM. d Quantification of integrin α9-GFP axon vesicle dynamics and total number of integrin α9-GFP vesicles in distal axon sections (n = 3 independent experiments) (for transport, Kruskal–Wallis with Dunn’s multiple comparison test was used; anterograde—p = 0.002, Kruskal–Wallis statistic = 12.57; retrograde—p = 0.0003, Kruskal–Wallis statistic = 16.64, bidirectional—p = 0.271, Kruskal–Wallis statistic = 2.610, static—p = 0.051, Kruskal–Wallis statistic = 5.951; for total number of vesicles—p < 0.0001, Kruskal–Wallis statistic = 21.81). Error bars represent mean ± SEM. e Schematic representation of Protrudin transport domain mutants. f Percentage of regenerating axons in neurons expressing mCherry-Protrudin domain mutants—FYVE (n = 4 independent experiments, 56 neurons) and KIF5/VAPA (n = 4 independent experiments, 56 neurons) compared to phospho-Protrudin as a positive control (n = 2 independent experiments, 24 neurons), and mCherry as a negative control (n = 3 independent experiments, 42 neurons) (Fisher’s exact test with analysis of stack of p values and Bonferroni–Dunn multiple comparison test). Error bars represent mean ± SEM.

