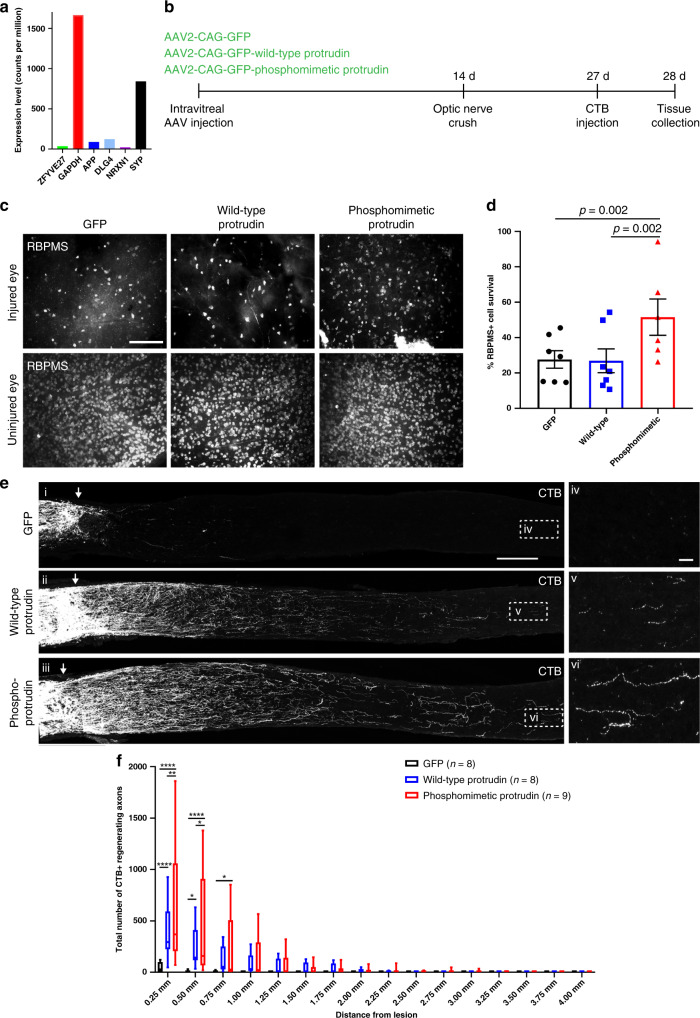
Fig. 5. Protrudin enhances regeneration of RGC axons following optic nerve crush.
a Protrudin mRNA levels during the progression of glaucoma in comparison to other neuronal markers. b Experimental timeline for optic nerve crush. c Representative images of retinal wholemounts stained for RBPMS (white) to label retinal ganglion cells in the uninjured and injured for each condition 2 weeks after optic nerve crush. Scale bars are 100 µm. d Quantification of RGC survival 2 weeks post crush. Eyes injected with phosphomimetic Protrudin have a higher percentage of RGC survival (n = 5 animals) compared to control (n = 7 animals, p = 0.007) or wild-type Protrudin (n = 7 animals, p = 0.002) (Fisher’s exact test with analysis of stack of p values and Bonferroni–Dunn multiple comparison test). Error bars represent mean ± SEM. e CTB-labelled axons in the optic nerves of mice transduced with viruses for wild-type Protrudin, phosphomimetic Protrudin and GFP control. Arrows indicate lesion site. Insets (iv-vi) show regenerating axons in the distal optic nerve. Scale bar is 200 μm and on inset is 20 μm (n = 8–9 animals/group). f Quantification of regenerating axons at increasing distances distal to the lesion site, displayed as mean ± SEM. Statistical significance was determined by two-way ANOVA with Bonferroni post hoc test for multiple comparisons. **p < 0.005, ***p < 0.001, ****p < 0.0001. Individual p values are as follows: p < 0.0001 for GFP vs. WT and GFP vs. phosphomimetic Protrudin at 0.25 mm, p = 0.003 for WT vs. phosphomimetic Protrudin at 0.25 mm, p = 0.01 for GFP vs. WT at 0.5 mm, p < 0.001 for GFP vs. phosphomimetic Protrudin at 0.5 mm, p = 0.02 for WT vs. phosphomimetic Protrudin at 0.5 mm and p = 0.01 for GFP vs. phosphomimetic Protrudin at 0.75 mm. The box plots show the first and third quartiles (the box limits), the median (horizontal line), and the minimum and maximum values (whiskers).

