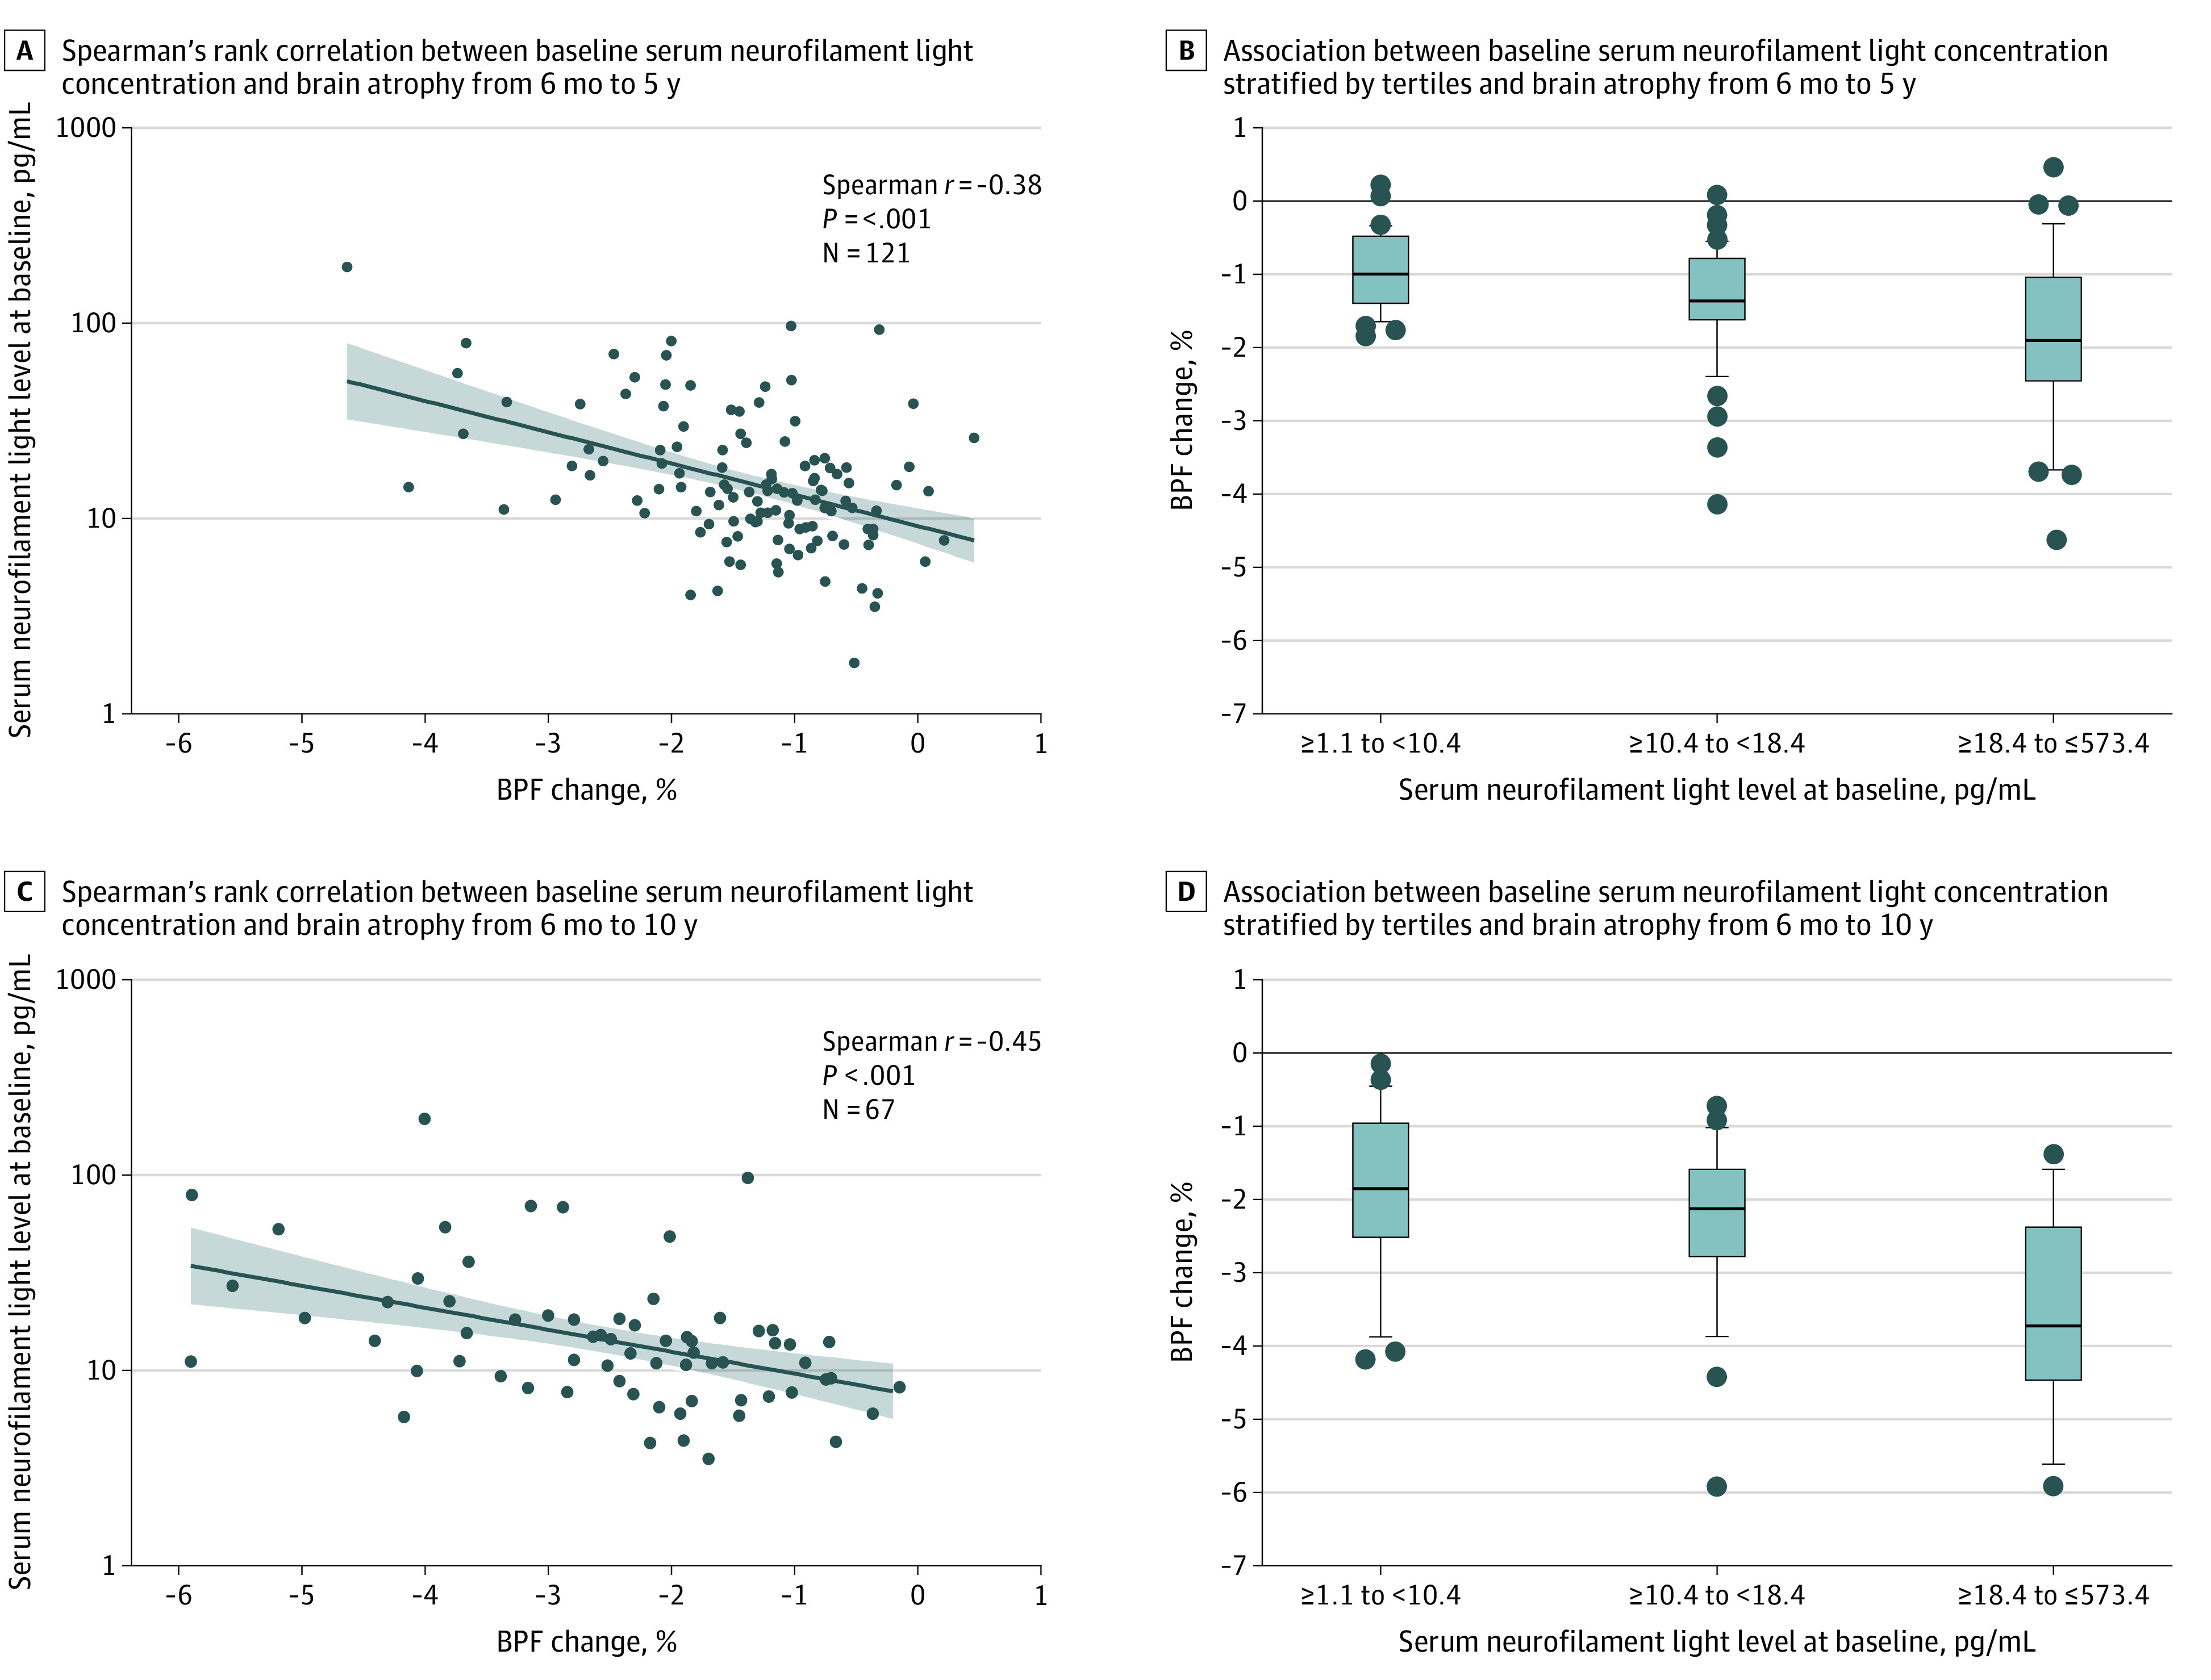
Figure 1. Association of Baseline Serum Neurofilament Light With Brain Atrophy at Years 5 and 10.

All brain parenchymal fraction (BPF) changes were calculated using the 6-month BPF measurement as baseline. A and C. Lines indicate linear fit to the observed data; shading, 95% CI for the estimated values from the linear fit; and dots, individual data points. B and D, lines indicate median; boxes, interquartile range; and dots, outliers.
