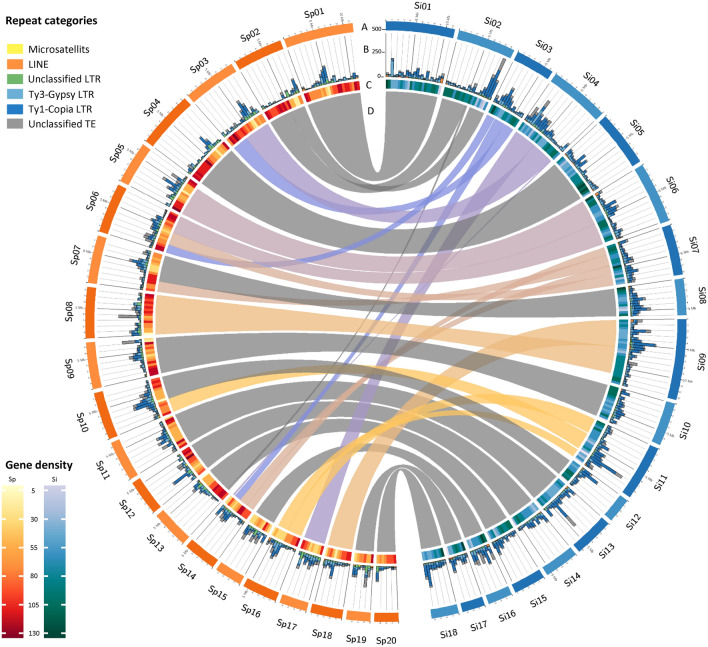
Figure 3.
Circos plot of genomes of S. polyrhiza 9505 (orange) and S. intermedia 8410 (blue). (A) tracks representing the size of the pseudomolecules with a corresponding scale in 1 Mbp steps, with highlights every 5 Mbps, (B) total length of repeat features (in kbps) (C) gene density and (D) pairwise sequence synteny. The synteny link between gi|13 and Si02 is based on an error in the ON assembly for clone 9509 (see Fig. 5). The region in question actually belongs to gi|2 as does the remaining part of Si02. Gene and repeat density are plotted in 0.5 Mbps bins. Data for S. polyrhiza 9505 are from Michael et al. 201725.

