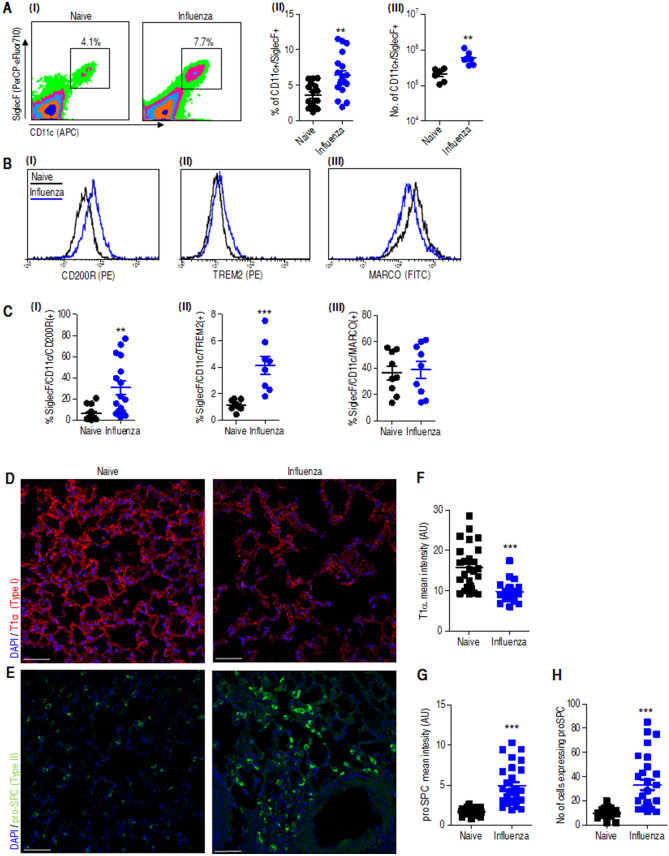
Figure 4.
A continuing lung resolution process at 25 dpii characterized by AMs and type II epithelial cell phenotype in the lung. Mice were infected i.n. with a dose of 20 pfu of the influenza virus PR8 (data labeled as blue) or administered with PBS (data labeled as black) and analyzed after 25 days. (A) (I) Representative FACS plots of SiglecF/CD11c-positive AMs extracted from whole lungs of influenza-infected mice (25 dpii) compared to those extracted from whole lungs of naïve mice, followed by a summary of alveolar macrophage percentages (II) and absolute numbers (III). n = 16–19 (II) and 6–7 (III) mice per group. (B) Representative flow cytometry histograms and (C) percentage of SiglecF/CD11b AMs expressing CD220R (I) TREM-2 (II) MARCO (III) in the lungs of PBS (black) and 25 dpii (blue). n = 8–16 mice per group. Immunofluorescence images of lungs naïve or influenza infected lungs (25 dpii) immune-stained for T1α (D) and proSPC (E). Mean fluorescence intensity quantification of T1 α (F) and proSPC (G) and the number of proSPC-positive cells (H) per field of view as quantified using Zen1 software (Zeiss). Graphs show the mean ± SEM intensity of 10–14 fields per mouse. Scale bar, 50 µm. **p < 0.01, ***p < 0.001 vs naïve.

