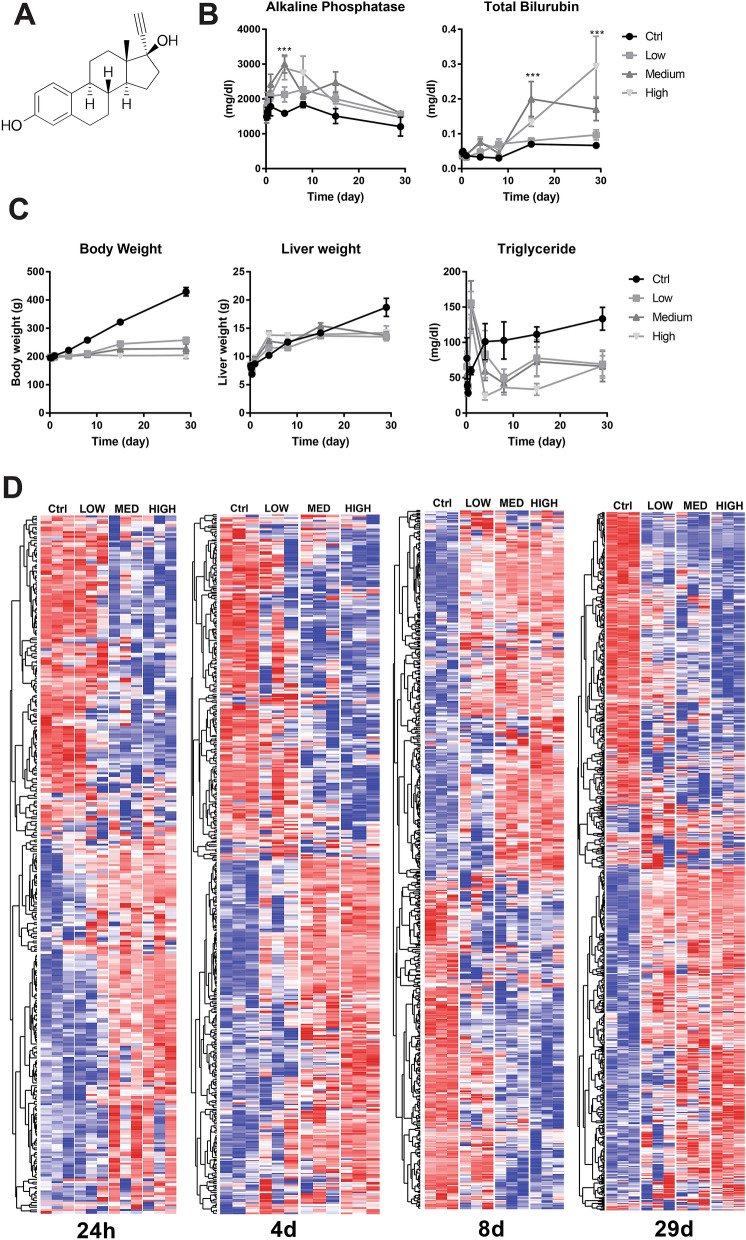
Figure 1.
(A) Structure of ethinyl estradiol (EE). Image obtained from Wikipedia (https://commons.wikimedia.org/wiki/File:Ethinylestradiol.svg). (B) Serum alkaline phosphatase and total bilirubin levels of animals that are exposed to EE. Graphs are generated by Graphpad Prism8 software (GraphPad Software Inc., La Jolla, CA, www.graphpad.com). (C) Total body weight, liver weight and serum triglyceride levels of animals that are exposed to EE. Graphs are generated by Graphpad Prism8 software (GraphPad Software Inc., La Jolla, CA, www.graphpad.com). (D) Hierarchical clustering of hepatic genes regulated by low-, medium- and high-dose EE exposure at selected time points. Cluster3 software (https://bonsai.hgc.jp/~mdehoon/software/cluster/) was used for clustering the differentially expressed genes. Data was visualized using Treeview Java (https://jtreeview.sourceforge.net/).

