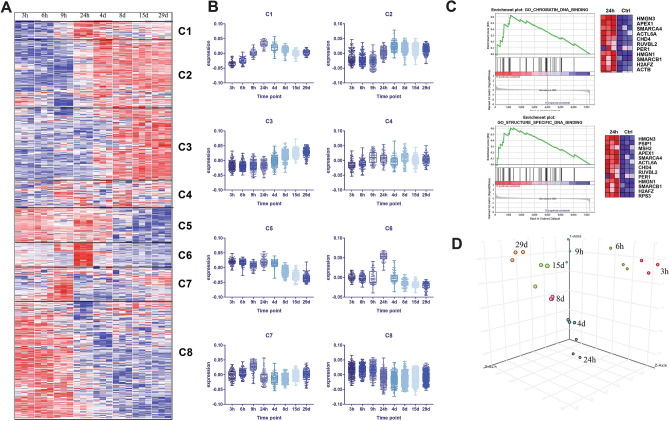
Figure 2.
(A) Hierarchical clustering of hepatic genes that are regulated by high-dose EE exposure over 29 days. Cluster3 software (https://bonsai.hgc.jp/~mdehoon/software/cluster/) was used for clustering the differentially expressed genes. Data was visualized using Treeview Java (https://jtreeview.sourceforge.net/). (B) Gene expression patterns of clusters (C1–8) based on average gene expression values that were identified in 2A. Graphs are generated by Graphpad Prism8 software (GraphPad Software Inc., La Jolla, CA, www.graphpad.com). (C) GO terms that are significantly associated with C6. GSEA analysis was performed. Figures are generated using Gene Set Enrichment Analysis software (https://www.gsea-msigdb.org/gsea/index.jsp)31,32. (D) PCA analysis of hepatic gene regulation time course dataset for high-dose EE exposure. Figure was generated using StrandNGS (Version 3.1.1, Bangalore, India).

