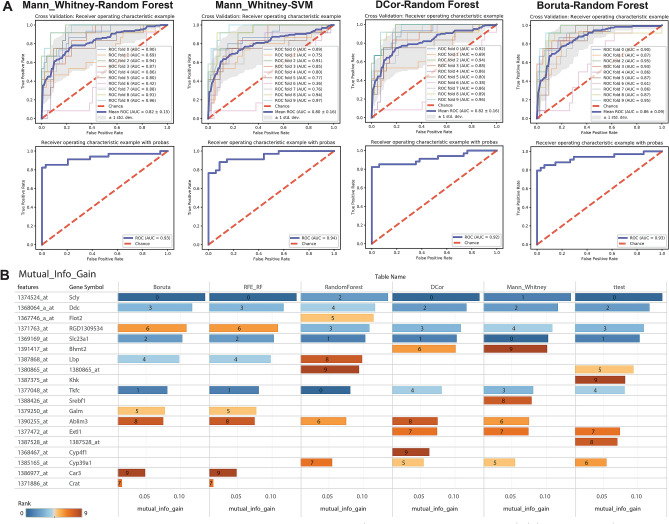
Figure 4.
(A) ROC curves for training (upper) and validation (lower) datasets for best performing feature selection-prediction method combinations. (B) List of genes identified by six feature selection methods and their contribution to prediction methods as indicated by mutual info gain for each gene. Color shows details about Rank. The marks are labelled by rank. Both graphs are generated using Tableau software (Seattle, WA, USA, https://www.tableau.com/).

