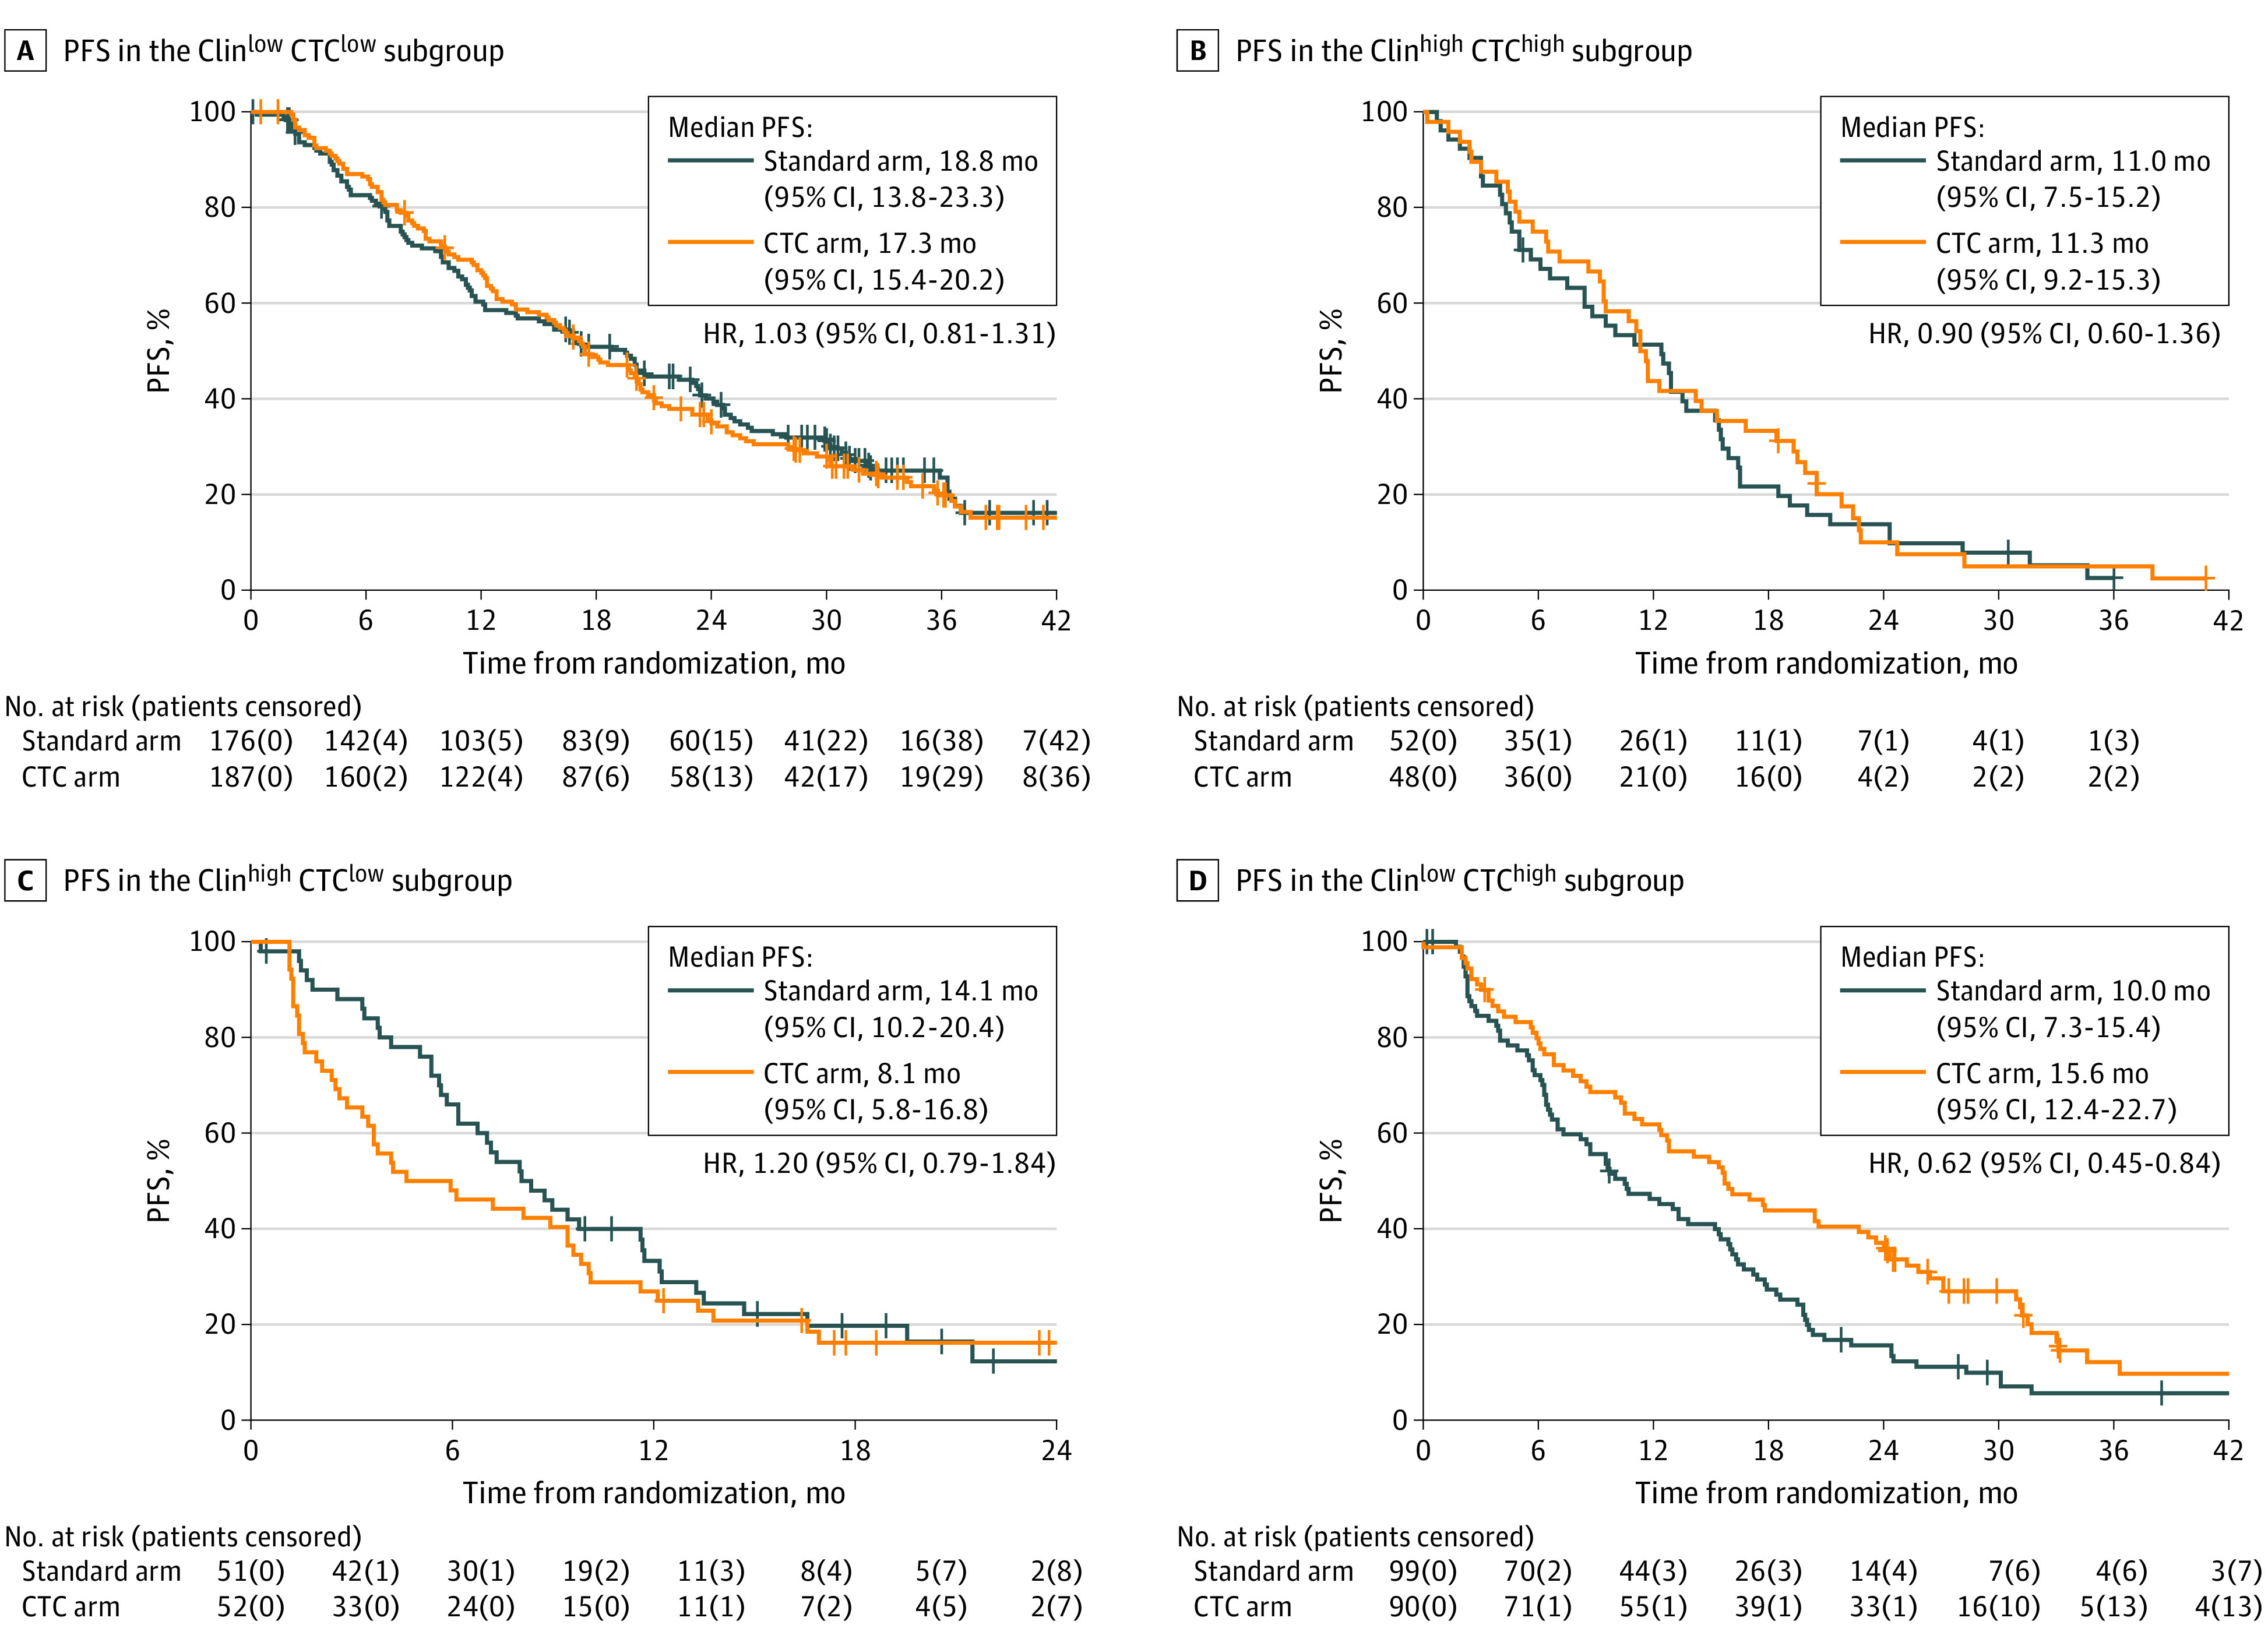
Figure 3. Kaplan-Meier Curves of Progression-Free Survival (PFS) for Each Arm, When Considering All Events.

A, The PFS in the Clinlow CTClow subgroup; B; The PFS in the Clinhigh CTChigh subgroup; C, The PFS in the Clinhigh CTClow subgroup; D; The PFS in the Clinlow CTChigh subgroup. Clinhigh indicates patients requiring chemotherapy according to the clinician-driven choice; Clinlow, patients requiring endocrine therapy according to the clinician-driven choice; CTC, circulating tumor cell; CTChigh, patients with ≥5 CTCs/7.5 mL; CTClow, patients with <5 CTCs/7.5 mL; HR, hazard ratio.
