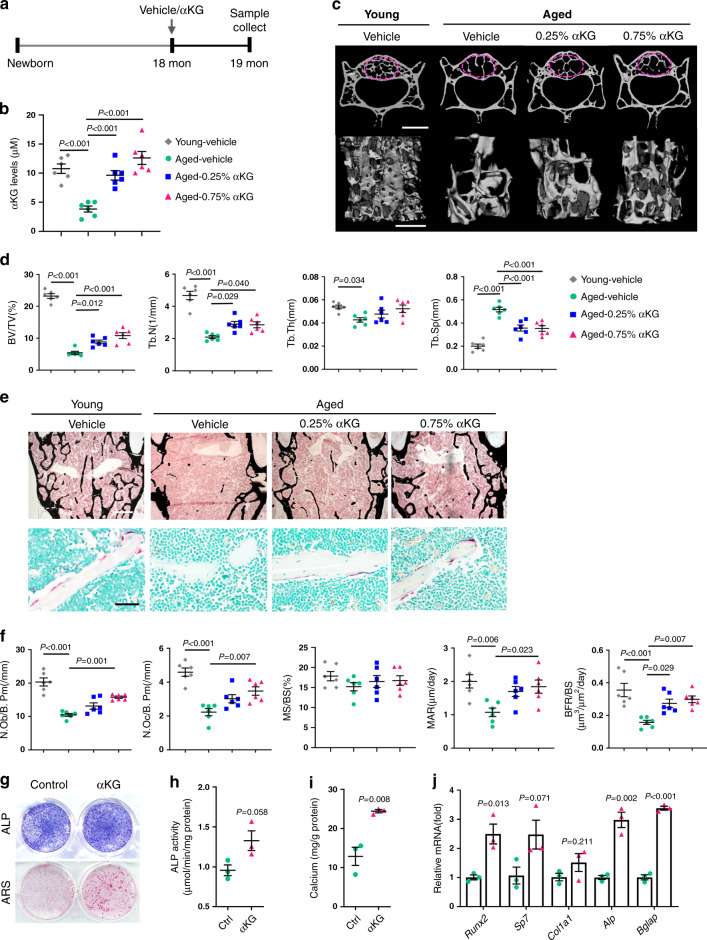
Fig. 1. αKG increases the bone mass of aged female mice.
a Schematic representation of αKG administration. b αKG administration increased circulating αKG levels of aged mice (n = 6, by one-way ANOVA with Tukey’s post hoc test). c Representative images of microCT reconstruction of lumber 4 (L4) vertebrae. Scale bar, 1 mm (upper) or 500 μm (lower). The magenta circles indicate the region of interest (ROI). d Quantitative microCT analyses of trabecular bone of L4 vertebrae (n = 6, by one-way ANOVA with Tukey’s post hoc test). Bone volume (BV/TV, %); trabecular number (Tb.N, 1/mm); trabecular thickness (Tb.Th, mm); trabecular separation (Tb.Sp, mm). e Representative Von Kossa staining and TRAP staining images of L4 vertebrae. Scale bar, 500 μm (upper) or 50 μm (lower). f Histomorphometric analyses of L4 vertebrae (n = 6, by one-way ANOVA with Tukey’s post hoc test). Number of osteoblasts (N.Ob/B.Pm, 1/mm); Number of osteoclasts (N.Oc/B.Pm, 1/mm); Mineral apposition rate (MAR, μm/day); Mineralizing surface per bone surface (MS/BS, %); Bone formation rate per bone surface (BFR/BS, μm3/μm2/day). g Representative images of alkaline phosphatase (ALP) and Alizarin Red S (ARS) staining of bone marrow MSCs isolated from the aged mice with or without αKG treatment. h Quantitative analysis of the ALP activity (n = 3, by two-tailed Student’s t-test). i Quantitative analysis of the mineralization (n = 3, by two-tailed Student’s t-test). j Quantitative RT-PCR results of mRNA expression of Runx2, Sp7, Col1a1, Alp, and Bglap in MSCs isolated from vehicle/αKG treated mice (n = 3, by two-tailed Student’s t-test). All data are shown as mean ± SEM.

