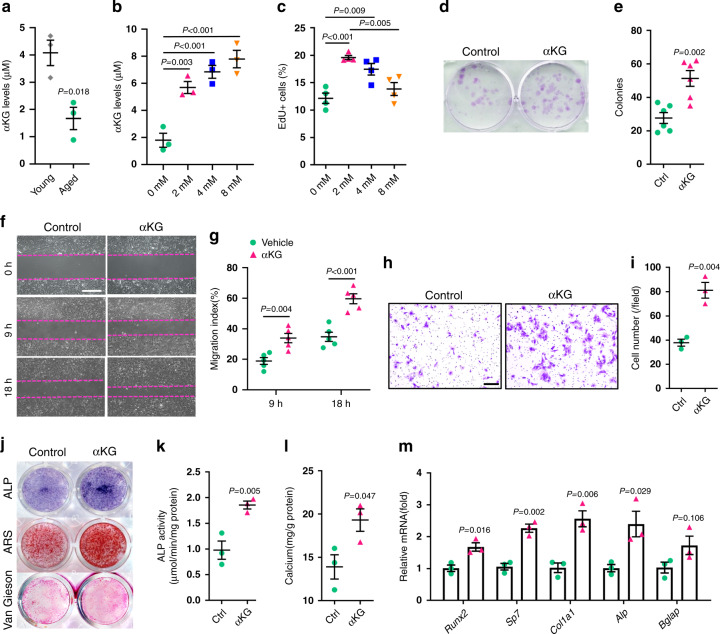
Fig. 4. αKG promotes proliferation, migration, and osteogenesis of aged MSCs.
a Intracellular αKG concentration in MSCs isolated from young (3-month-old) and aged (18-month-old) mice (n = 3, by two-tailed Student’s t-test). b Intracellular αKG concentration in aged MSCs in response to αKG treatment for 3 days (n = 3, by one-way ANOVA with Tukey’s post hoc test). c EdU incorporation in aged MSCs treated with different concentrations of αKG (n = 4, by one-way ANOVA with Tukey’s post hoc test). αKG treatment increased the number of EdU+ cells. d Crystal violet staining of colony-forming units of MSCs. e Quantitative analysis of colony-forming unit assay (colonies per well, n = 6, by two-tailed Student’s t-test). f, g Scratch assay of aged MSCs and quantitative analyses. Magenta dotted lines indicate start (0 h), half (9 h), and end (18 h) positions of MSCs after scraping (n = 5, by two-way ANOVA with Sidak’s multiple comparisons test). Scale bar, 500 μm. h, i Crystal violet staining of migrated MSCs from the upper chamber to bottom lower of the membrane and quantitative results (n = 3, by two-tailed Student’s t-test). Scale bar, 100 μm. j Representative images of ALP, ARS and Van Gieson staining of aged MSCs. k Quantitative analysis of the ALP activity in MSCs (n = 3, by two-tailed Student’s t-test). l Quantitative analysis of calcium mineralization in MSCs (n = 3, by two-tailed Student’s t-test). m Quantitative RT-PCR results of mRNA expression of Runx2, Sp7, Col1a1, Alp, and Bglap in MSCs treated with vehicle/αKG (n = 3, by two-tailed Student’s t-test). Data are expressed as mean ± SEM.

