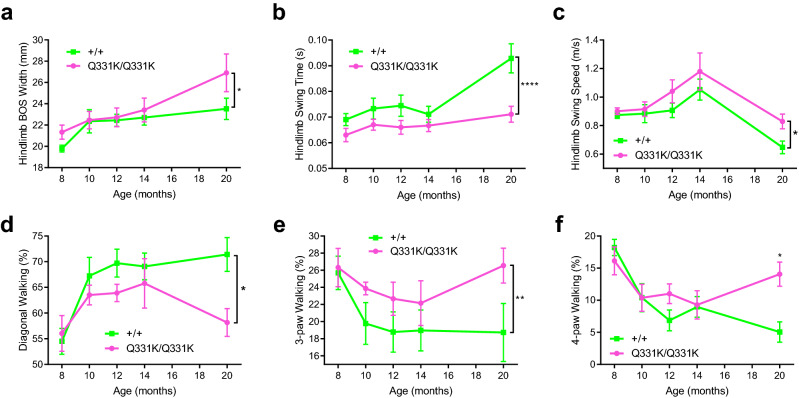
Figure 2.
Catwalk gait analysis of female wild-type and TDP-43Q331K/Q331K mice shows gait deficits in aged mutants. (a) Hindlimb base of support (BOS) (P < 0.05; two-way ANOVA). (b) Hindlimb swing time (P < 0.0001; two-way ANOVA). (c) Hindlimb swing speed (P < 0.05; two-way ANOVA). (d) Percentage of diagonal walking (P < 0.05; two-way ANOVA). (e) Percentage of 3-paw walking (P < 0.01; two-way ANOVA). (f) Percentage of 4-paw walking (P < 0.05 at 20 months on multiple comparisons; two-way ANOVA). All data is from 8 to 20 months of age (n = 10 per genotype (8 months); 10 wild-type, 9 mutants (10 and 12 months); 9 per genotype (14 months); 9 wild-type, 7 mutants (20 months)). Error bars represent mean ± s.e.m. *P < 0.05, **P < 0.01, ****P < 0.0001.

