
Fig. 2. Interfacial adhesion energy measurements.
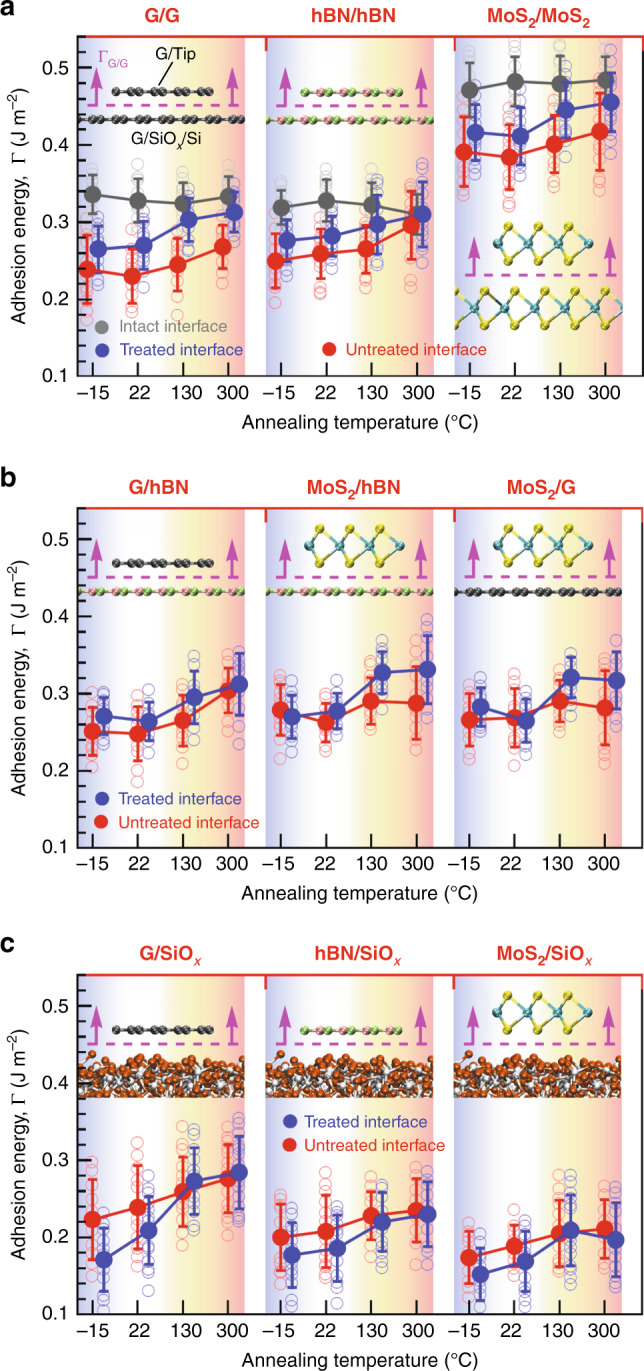
IAE values as a function of annealing temperatures at the a G, hBN, and MoS2 homointerfaces; b G/hBN, MoS2/hBN, and MoS2/G heterointerfaces; and c G/SiOx, hBN/SiOx, and MoS2/SiOx heterointerfaces using normal force microscopy technique. Filled gray circles in a denote the intrinsic IAE values at the intact G, hBN, and MoS2 homointerfaces, whereas filled blue (red) circles in a–c denote the IAE values between 2D crystal tips and precooling-treated (untreated) substrates. Each open transparent gray circle in a represents a single IAE measurement at the intact homointerfaces, whereas each data point shown in open transparent blue and red circles in a, b represents the IAE of the tips on an individual 2D crystal flake averaged over ten measurements from different locations of the flake surface. Similarly, each data point shown in open transparent blue and red circles in c represents the average IAE value obtained from 10 measurements within an individual small region (1 μm × 1 μm) of SiOx substrate. Each filled circle in a–c is presented as average of all corresponding open circles ± standard deviation. Insets in a–c illustrate ball-and-stick representation of various tip/substrate interfaces where carbon, boron, nitrogen, molybdenum, sulfur, silicon, and oxygen atoms are shown in gray, green, pink, cyan, yellow, white, and orange, respectively.