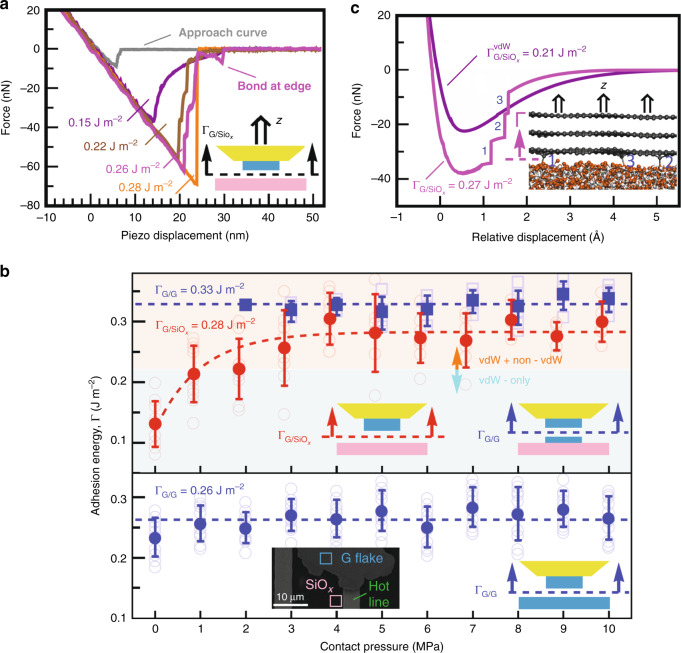
Fig. 3. Interaction mechanism at G/SiOx heterointerface.
a Typical retraction F–d curves of the G/SiOx interface recorded at no contact pressure (in purple) and 5 MPa (in brown, magenta and orange) and also a typical approach F–d curve (in gray). b IAE values as a function of contact pressure at the intact G homointerfaces (filled blue squares in top panel), G/SiOx interfaces (filled red circles in top panel), and aged G homointerfaces (filled blue circles in bottom panel). Each open transparent symbol represents a single IAE measurement at the given contact pressure. Each filled symbol is presented as average of all corresponding open symbols ± standard deviation. From 110 IAE measurements shown in the top panel, 33 and 77 contacts result in the separation of G crystal tip across the thickness of the nanomesa (open blue squares) and from the SiOx surface (open red circles), respectively. In the top panel, cyan and orange shaded regions indicate the vdW-only and vdW+non-vdW interactions of G/SiOx, respectively, where the lift-off in the vdW-only region is relatively gradual in comparison to the vdW+non-vdW region. Dashed blue lines denote an overall average IAE value of 0.328 ± 0.022 and 0.263 ± 0.032 J m−2 at the intact G homointerface (top panel) and aged G homointerface (bottom panel), respectively. Dashed red line in the top panel represents the best fit to the data, indicating the pressure dependence of IAE at the interface with an average value of 0.284 ± 0.046 J m−2 taken within the pressure-independent region (i.e., ≥3 MPa). Inset of bottom panel: SEM image showing 2 μm × 2 μm square regions of G (in turquoise) and SiOx (in rose) substrates on which all measurements are performed in close proximity to the microheater. c MD-calculated force versus relative displacement curves for the vdW-only interaction of G/SiOx (in purple) and vdW+non-vdW interaction of G/SiOx (in magenta) with three covalent C–O–Si bonds at the interface. Each force jump labeled by 1, 2, and 3 represents the break of the corresponding covalent bond, as illustrated by the MD pull-off simulation in the inset.

