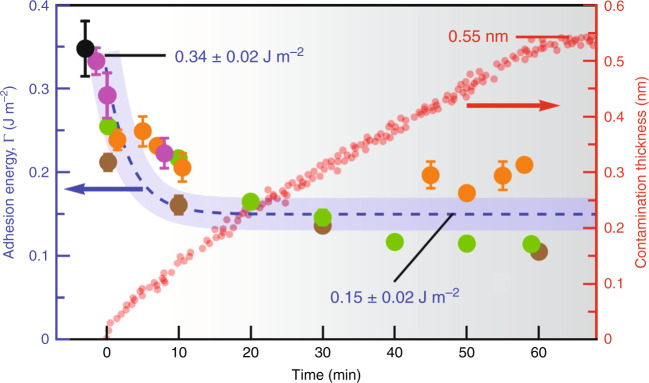
Fig. 5. Adhesion energy evolution in G crystal.
Temporal evolution of the adhesion energy (left axis in blue) and contamination thickness (right axis in red) measured on the mechanically exfoliated HOPG surface during the first 60 min of air exposure. Adhesion energy is extracted from WCA measurements of ref. 46, ref. 47, ref. 48, ref. 49, and ref. 24 denoted by black, brown, orange, magenta, and green circles, respectively. Adsorbed contamination layers linearly grow within the first 60 min of air exposure, reaching a thickness of ~0.55 nm, and then the growth rate considerably decreases and plateaus at ~0.60 nm after several hours24.

