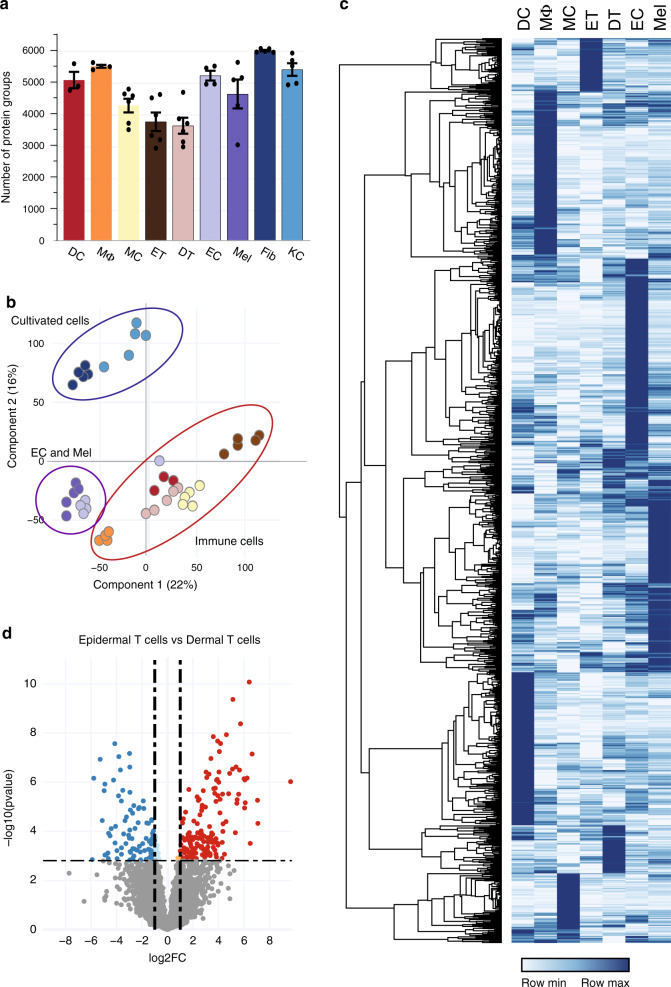
Fig. 5. In-depth MS-based proteomic analysis of skin-associated cellular subsets.
a Single-run analyses of DC; CD1A+dendritic cells (N = 3), MΦ; macrophages (N = 4), MC; mast cells (N = 6), ET; epidermal T cells (N = 6), DT; dermal T cells (N = 6), EC; endothelial cells (N = 4), Mel; melanocytes (N = 5), Fib; fibroblasts (N = 5) and KC; keratinocytes (N = 5) using data-independent (DIA) acquisition. Data are presented as mean±SEM. N represents number of biologically independent samples. The number of quantified protein groups for each major cell lineage is roughly similar. Source data are provided as a Source Data file. b Principal component analysis (PCA) of all proteomes from cellular subsets. Color code from panel (a). The PCA separates cultivated fibroblast and keratinocytes from FACS-sorted endothelial cells (EC) and melanocytes (Mel) as well as from the immune cells, as indicated by enclosing ovals. c Heatmap of protein abundances of 1272 differentially expressed proteins (ANOVA, FDR < 0.01, FCH > 2) after unsupervised hierarchical clustering. d Differentially expressed proteins in epidermal T cells vs. dermal T cells (volcano plot, FDR < 0.05, FCH > 2).

