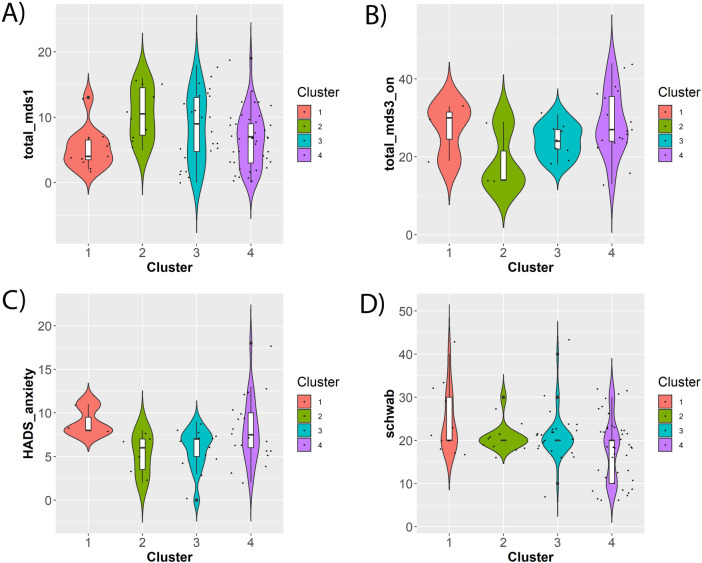
Figure 4.
Examples of significant differences between clusters with respect to clinical baseline features in PD patients after correction for confounding effects (see “Methods” section). (A) MDS-UPDRS I score (AETIONOMY PD); (B) MDS-UPDRS III on treatment score (ICEBERG); (C) HADS anxiety score (ICEBERG); (D) Schwab-England Scale in % (AETIONOMY PD). The Figures shows statistical distributions as violin plots (i.e. boxplots plus kernel density estimates), and individual data points are shown as superimposed dots.

