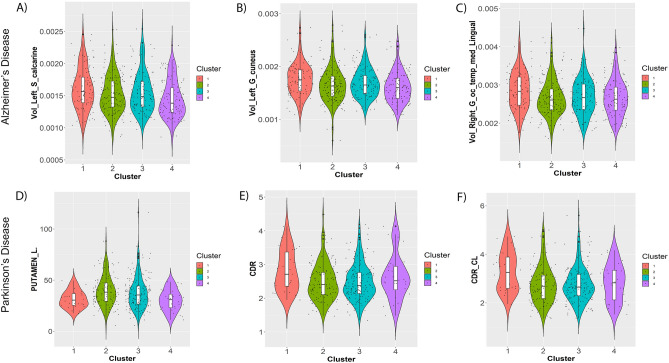
Figure 5.
Example of significant differences between clusters with respect to brain imaging derived features at study baseline/time of first disease diagnosis (see “Methods” section). (A) left calcarine sulcus in AD patients; (B) left cuneus gyrus in AD patients; (C) volume of right medial occipitotemporal gyrus in AD patients; (D) DaTSCAN left Putamen—ratio to age expected value in healthy controls; (E) DaTSCAN Count Density Ratio: Caudate/Putamen; (F) DaTSCAN Count Density Ratio (CL): Caudate contralateral/Putamen contralateral. The Figures shows statistical distributions as violin plots (i.e. boxplots plus kernel density estimates), and individual data points are shown as superimposed dots.

