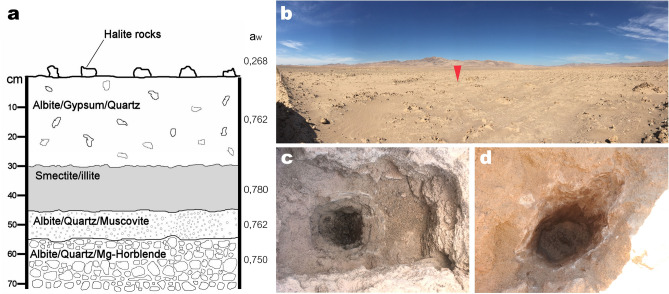
Figure 1.
Characteristics of the study site. (a) Diagram of the structure, composition and mean water activity of soil layers with depth. (b) General view of the sampled site. The red arrow marks the first pit from where samples were taken, seen in detail in (c). (d) Another pit dug 4 km away from the pit shown in (c). Pit diameters are approximately 1 m length, 60 cm wide and 60 cm deep. Both (c, d) show a clear color change between the lower wet clay-rich layer and the upper soil layers.

