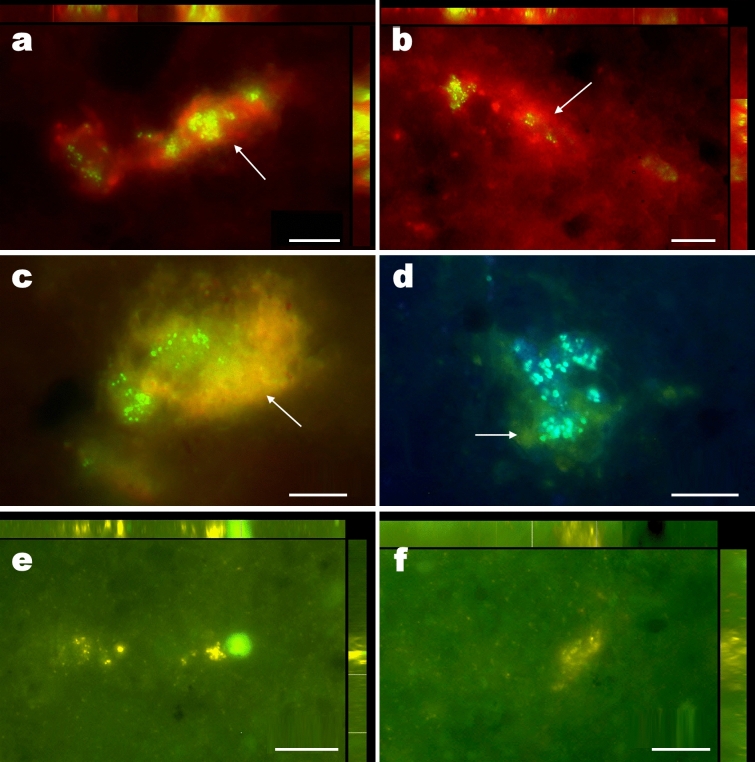
Figure 4.
Fluorescence microscopy images of bacterial aggregates and EPS from Yungay subsurface clay samples. (a, b), Maximum image projection 3D images (upper and right bars: X and Y view of stacked sections respectively, 10 sections; z = 0.35 μm) of SYBR green stained bacterial cells (green-yellow signal) and autofluorescence red signal (arrow), potentially proceeding from exopolysaccharides. The sGFP and Rhodamine filters were used for both images (Multichannel Image Acquisition system). (c) Single section image of SYBR green stained bacterial cells (green signal) and autofluorescence orange (arrow) signal potentially proceeded from EPS; sGFP filter. (d) Single section image of SYBR green stained bacterial cells (blue signal) and autofluorescence green (arrow) signal potentially proceeded from EPS; DAPI filter. (e, f), Maximum Image Projection 3D images (upper and right bars: X and Y view of stacked sections respectively, 10 and 15 sections respectively; z = 0.35 μm) of CTC stained and metabolically active bacterial cells (yellow-orange CTF signal).

