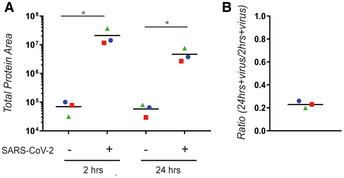
Figure 4. SARS‐CoV‐2 nucleocapsid phosphoprotein decreases over time.

- The amount of SARS‐CoV‐2 nucleocapsid phosphoprotein was quantified using LC‐MS/MS.
- After subtraction of the background (unchallenged AMs), the ratio between the amount of SARS‐CoV‐2 nucleocapsid phosphoprotein at 24 and 2 h was calculated. (A–B) Each colour corresponds to a donor; 3 different donors were analysed. An ordinary one‐way ANOVA test was used for statistical analysis: ns, not significant; *P ≤ 0.05.
Alveolar macrophages from different donors were purified from BAL and treated with SARS‐CoV‐2 for either 2 or 24 h.
Source data are available online for this figure. Source data are available online for this figure.
