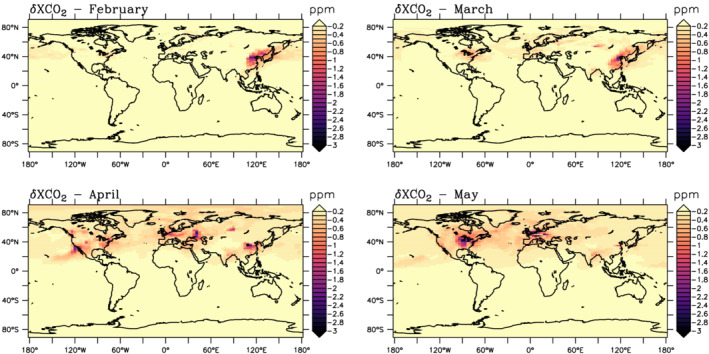
Figure 1.

Monthly minimum gradients of δXCO2(the perturbation induced by changes in FFCO2between 2019 and 2020) relative to the South Pole simulated over the months of February, March, and April 2020 around local noon. They are all negative. The minimum value in the figure is −2.3, −2.2, −3.5, and −7.4 ppm in February, March, April, and May, respectively. Subtracting δXCO2at South Pole removes the changes induced by the global growth rate.
