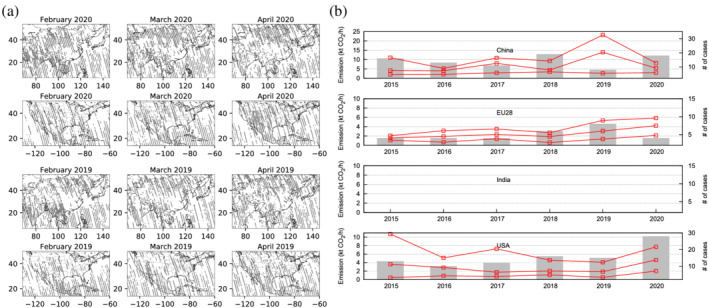
Figure 2.

(a) location of “good‐quality” OCO‐2 XCO2retrievals in Southeast Asia and in conterminous United States, Mexico, and some Central American countries during the months February, March, and April 2020 and 2019. (b) The three red lines are the time series of emission quartiles from individual emitting sources based on OCO‐2 per year for February and March (China) or 20 March to 31 May (EU28, India, and United States). The gray boxes indicate the number of cases used in the statistics, with a minimum of 4 (which is never reached for India).
