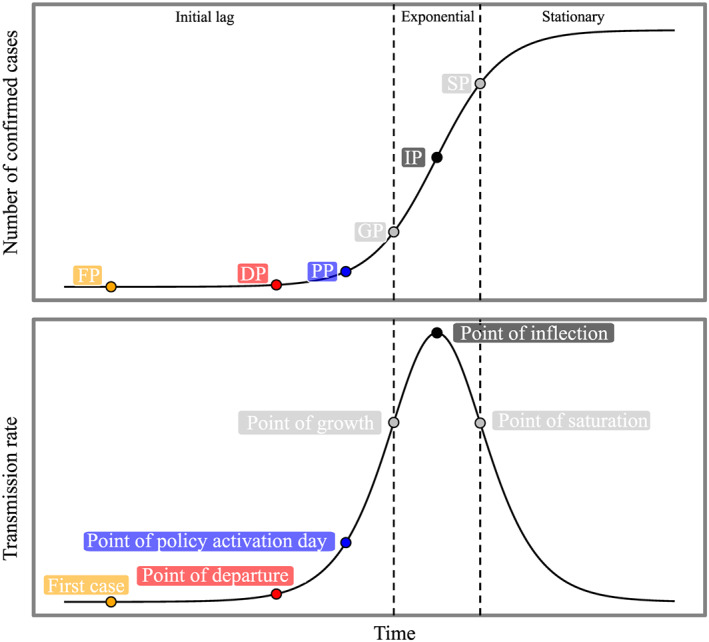
Figure 1.

The schematic diagram of logistic model used in this study. IP (inflection point) is given by time of max(Rt); GP (point of growth) and SP (point of saturation) are given by the time of max(dRt/d t) and min(dRt/d t), respectively. DP (point of departure) was assumed as five cases per million; PP, point of policy activation day. Detailed timeline for each region is provided in the supporting information.
