
FIGURE 1.
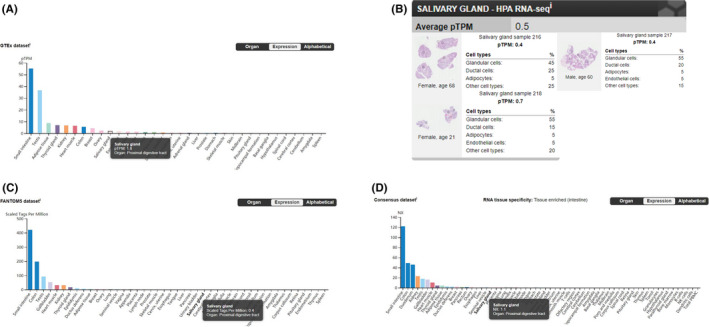
The expression and distribution of ACE2 in normal human tissues. A, Data from GTEx Dataset showing mRNA expression of the ACE2 gene in salivary glands (pTPM: 1.8), with the highest expression level being found in the small intestine (pTPM: 55.2). (Image available from https://www.proteinatlas.org/ENSG00000130234‐ACE2/tissue/). B, Data from HPA Dataset showing mRNA expression of the ACE2 gene being detected in normal salivary gland tissue (average pTPM: 0.5), with the highest level of expression being observed in glandular cells (Image available from https://proteinatlas.org/ENSG00000130234‐ACE2/tissue/Salivary+gland#rnaseq/). C, Data from FANTOM5 Dataset showing mRNA expression of the ACE2 gene in salivary glands (scaled tags per million: 0.4), with the highest expression level being found in the small intestine (scaled tags per million: 420.9). (Image available from https://www.proteinatlas.org/ENSG00000130234‐ACE2/tissue/). D, Data from Consensus Dataset showing mRNA expression of the ACE2 gene by salivary glands (NX: 1.1), with the highest expression level being found in the small intestine (NX: 122.0). (Image available from https://www.proteinatlas.org/ENSG00000130234‐ACE2/tissue/)